Stock Market Update: Make or Break Time
Stock-Markets / US Stock Markets Apr 13, 2008 - 10:12 PM GMTBy: Dominick
 Not only did Friday's inexorable drip lower invalidate several bullish charts that would have seen an extension of the April rally, it also crushed positive sentiment on the Street and reiterated the prevailing wisdom of a bear market. But as we now enter the mine field of earnings season next week, TTC members have covered their shorts as our indications suggest the market has reached a crucial potential support level that will prove to be make or break early next week. Besides, we can always get back on Sunday night when we actually start our week.

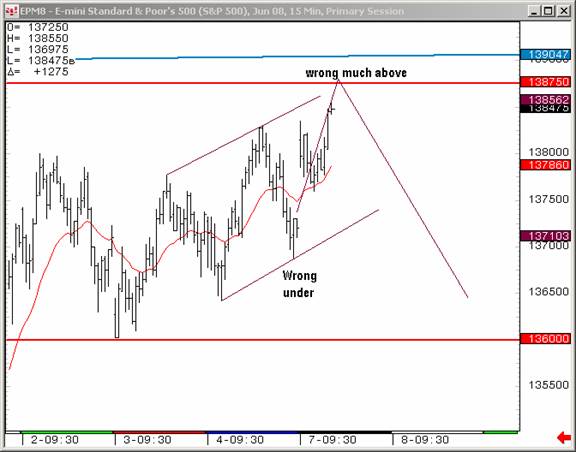
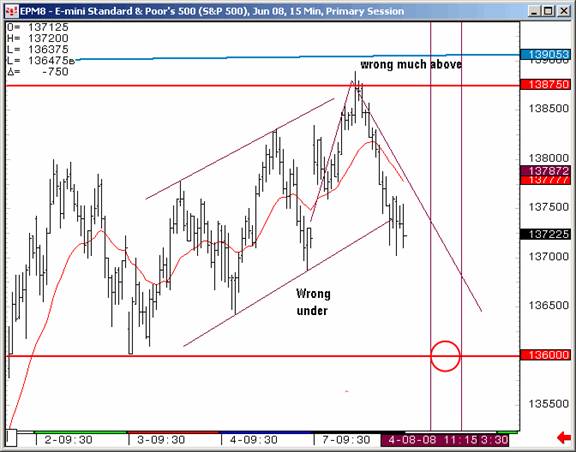
Last week's update spoke of “a crucial area that will determine whether there's still one more new high in this rally or it's now time for consolidation.” The chart above shows Monday's open making the Friday lows a true bounce off that support level, and a subsequent rally into the expected target, which proved to be the high of the week. By Tuesday, the chart looked like this:

Anyone who's read this update on anything approaching a regular basis, even for just the past few weeks (if not the past few years), knows we do business a little different at TTC. Sometimes we have wave counts, other times we just trade the action off of our numbers or listen to some oscillator no one else has. The fact is that it's our unique blend of Elliott wave theory with proprietary targets and technical indicators, in combination with the community spirit of our forums and real time chat room, that produce the consistently accurate market analysis and profitable trades our members enjoy.

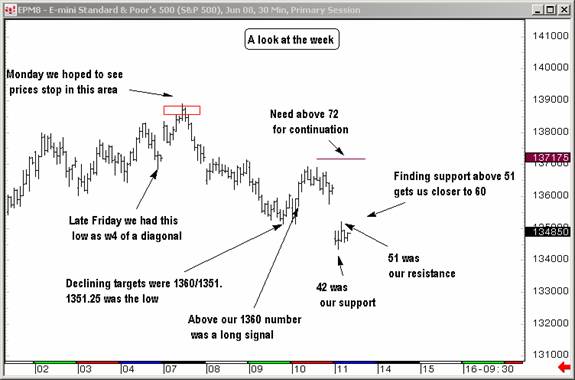
The chart above, which is a retrospective of most of the week illustrates our eclectic approach. First, on the left, is Friday's low based on Elliott wave, and the target for Monday generated through a mix of different techniques. Whereas as many traders were probably taken by surprise at Monday's rally, we were able to see it for what it was: one more high that was bound to roll over. On Wednesday and Thursday the S&P oscillated between our two targets for the decline, recognition that is a sure sign of good numbers.

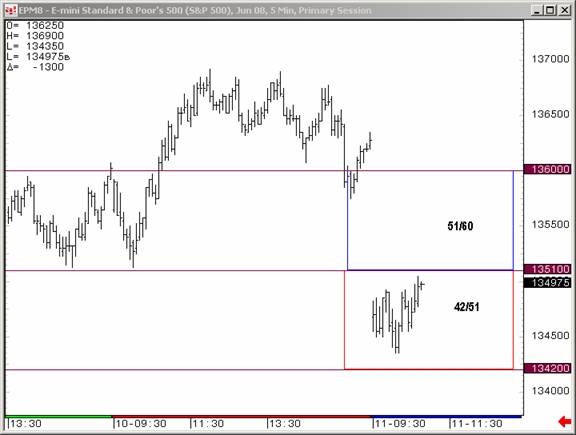
One thing TTC doesn't do is trade the news. We react to whatever the market hands out. Friday's surprise gap down took us into the lower range described in the chart above. Before the opening bell, our strategy was to look for a test of 1351 from below to signal which direction this market wanted to go. 1351 was hit and promptly sold, indicating the lower range at best. As 1442 was reached, it, too, was recognized by the market before finally giving way to the despondent sellers that characterized the day, the heart broken believers in the April fool's -rally. But, as mentioned, members are already aware of our all-important line in the sand for next week, have access to the big picture charts in the weekly maps section, and will trade accordingly. More importantly, we have been watching a long term cycle that is due soon. Let see what happens…..
So, do you want to learn how to trade short term time frames? Would you like access to next week's charts posted in the weekly forum right now? Ten to twenty big picture charts are posted every weekend. If you feel the resources at TTC could help make you a better trader, don't forget that TTC will be closing its doors to new retail members on May 31,2008 . Institutional traders have become a major part of our membership and we're looking forward to making them our focus.
Are you ready to breakout from bias and trade these volatile markets come what may? The opportunity to join the TTC community of traders is slipping away from retail investors. We originally thought we would close the doors to new retail in June or July, but I've decided to move that up closer to May 31, Memorial Day weekend. If you're really serious about trading learn more about what TTC has to offer and how to join now .
TTC is not like other forums, and if you're a retail trader/investor looking to improve your trading, you've never seen anything like our proprietary targets, indicators, real-time chat, and open educational discussions. But the only way to get in is to join before the lockout starts - once the doors close to retail members, we'll use a waiting list to accept new members from time to time, perhaps as often as quarterly, but only as often as we're able to accommodate them. Don't get locked out later, join now.
Have a profitable and safe week trading, and remember:
"Unbiased Elliott Wave works!"
By Dominick , a.k.a. Spwaver
www.tradingthecharts.com
This update is provided as general information and is not an investment recommendation. TTC accepts no liability whatsoever for any losses resulting from action taken based on the contents of its charts, commentaries, or price data. Securities and commodities markets involve inherent risk and not all positions are suitable for each individual. Check with your licensed financial advisor or broker prior to taking any action.
Dominick Archive |
© 2005-2022 http://www.MarketOracle.co.uk - The Market Oracle is a FREE Daily Financial Markets Analysis & Forecasting online publication.


