Looking to be Long the Russell 2000 Stock Market ETF
Stock-Markets / US Stock Markets Apr 08, 2008 - 02:58 PM GMTBy: Mike_Paulenoff
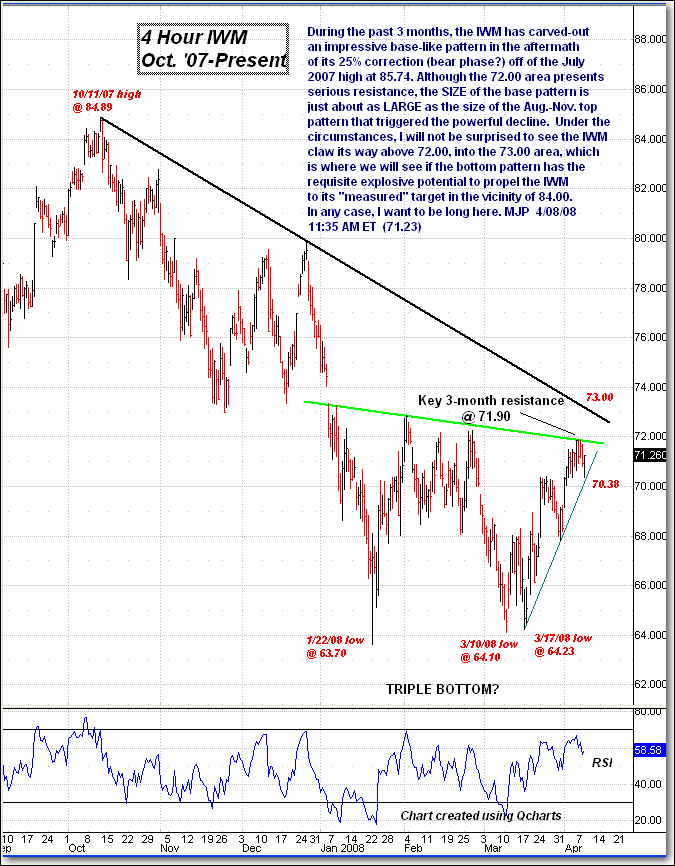
 During the past three months, the Russell 2000 Small-Cap ETF (AMEX: IWM) has carved out an impressive base-like pattern in the aftermath of its 25% correction (bear phase?) off of the July 2007 high at 85.74. Although the 72.00 area represents serious resistance, the size of the base pattern is just about as large as the size of the Aug-Nov top pattern that triggered the powerful decline.
Under the circumstances, I will not be surprised to see the IWM claws its way above 72.00 into the 73.00 area, which is where we will see if the bottom pattern has the requisite explosive potential to propel the IWM to its "measured" target in the vicinity of 84.00. In any case, I want to be long here.

By Mike Paulenoff
Mike Paulenoff is author of the MPTrader.com (www.mptrader.com) , a real-time diary of Mike Paulenoff's trading ideas and technical chart analysis of Exchange Traded Funds (ETFs) that track equity indices, metals, energy commodities, currencies, Treasuries, and other markets. It is for traders with a 3-30 day time horizon, who use the service for guidance on both specific trades as well as general market direction
© 2002-2008 MPTrader.com, an AdviceTrade publication. All rights reserved. Any publication, distribution, retransmission or reproduction of information or data contained on this Web site without written consent from MPTrader is prohibited. See our disclaimer.
Mike Paulenoff Archive |
© 2005-2022 http://www.MarketOracle.co.uk - The Market Oracle is a FREE Daily Financial Markets Analysis & Forecasting online publication.


