Stock Market Bottoming Process Continues- Good News Ahead
Stock-Markets / US Stock Markets Mar 21, 2008 - 01:59 PM GMTBy: Clif_Droke
 Investors have had to endure a tremendous onslaught of horrendous news that has shaken the financial sector to the core. One pundit likened the past few months to flying a hang glider in a hurricane. That's how it has felt to all of us as bad news begat more bad news…which in turn drove the financial markets lower.
The good news is that the winds have now diminished and the dark clouds are on the verge of lifting. It's time now to focus on the positive things to come instead of dwelling on the negatives of yester-year. That's the message the stock market is telling to anyone who will listen.
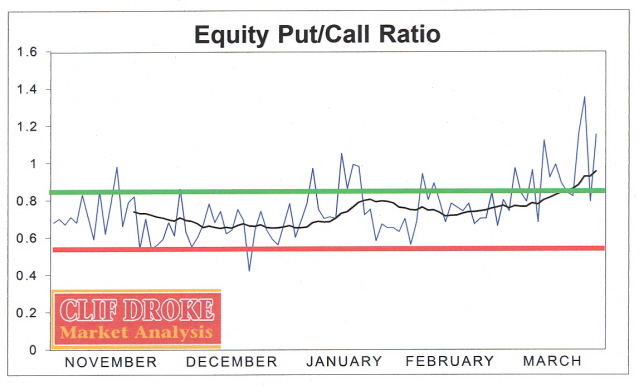
Last week I asserted that an interim bottom process was already well underway for the U.S. stock market. The action and events of the last several days have thus far confirmed the accuracy of that statement. Market psychology doesn't lie, and neither do the technical indicators. Put/call and short interest ratio measures have hit extremes normally associated with dominant market lows. Just look at the latest reading in the CBOE Equity Put/Call ratio along with the 15-day moving average. The latest signals are bullish from a contrarian stance.

The market's message is clear: It's time to start looking for better days ahead instead of focusing on the fears of yesterday.
Meanwhile, the wave form pattern for the S&P 500 index is looking more and more constructive by the week. The internal momentum configuration for the NYSE broad market is also showing improvement. The tape itself is starting to clear up and the fact that the market was able to hold above its lows in the past several days in the face of horrendous, earth-shattering news is evidence enough from a tape reading standpoint that the market has already discounted the worst news and is looking forward to better days.
Smart traders are those who get in line with the market's future outlook, not the past. While the average retail investor embraces a rear-view mirror approach to the market and is afraid of his own shadow right now, the corporate insiders have been loading up on shares of their own companies. This is the message of the Gambill Oscillator, which measures what corporate executives of the Russell 3000 companies are doing with their company's shares. The insiders were seen busily accumulating stocks during the past few weeks in anticipation of an interim bottom and eventual turnaround. Their prescience should soon be rewarded.
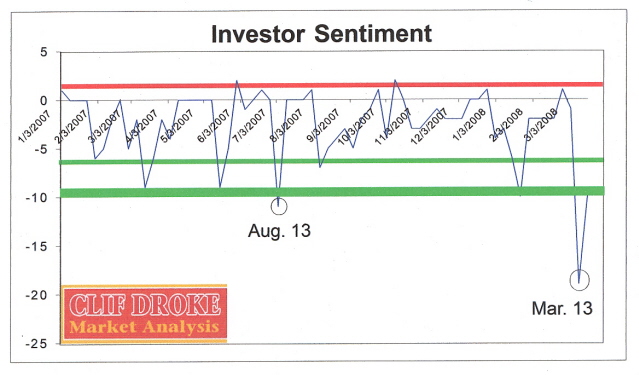
To give you some idea of just how bearish the average investor has been in just the past 7-10 days, take a look at the following chart.

This shows that the retail investor crowd was almost unanimous in its belief that another down-leg was beginning and that more financial catastrophes are on the way. My own in-house investor sentiment poll registered an astounding 90% bearish reading last week, with only one respondent claiming to be bullish! This is the highest reading of bears versus bulls my weekly poll has shown in the past 15 months.
While many respondents to my previous article suggested to me that “contrarianism no longer works,” I would beg to differ. The market action of just the last few days in the face of the Bear Stearns debacle should be sufficient to convince the skeptics that this market hasn't run out of lives yet! The Fed's responsiveness to the financial crisis in providing abundant liquidity will go a long way in preventing the sort of meltdown that many pundits are predicting.
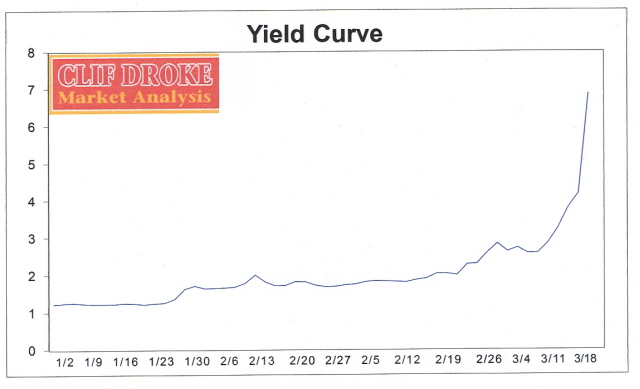
Speaking of liquidity, the Federal Reserve cut the Fed funds rate 75 basis points this week and brought the target rate down to 2.50. That's good news from a monetary liquidity standpoint and already the yield curve has shown tremendous improvement over the past few weeks. This means it's only a matter of time (perhaps 3-4 months) before the economy starts showing improvement. While everyone from Wall Street analysts to Main Street observers continue wringing their hands over the talk of recession, most have completely missed the undeniable signs that recovery is on its way.
Just take a look at the extraordinary trend in the yield curve in the past few weeks. Cut this chart out and paste it to your forehead: This is the biggest story for the financial markets and the economy right now and almost no one is talking about it . Everyone is too busy crying over spilt milk concerning the economic slowdown that they've forgotten how to look ahead to the future. They're all still looking backward instead of forward, which is what counts where the market is concerned.

A headline from the Financial Times newspaper on March 17, seemed to capture what most investors are feeling right now: “Wall Street waits for the next domino to fall.” On the front page of the March 18 issue of FT there was a graphic depiction of dominoes toppling along with the headline, “After Bear: turmoil in the markets.” The financial press has gone out of its way to evoke the image of the toppling domino effect in the financial markets. They did the same thing 10 years ago back in 1998 with the LTCM debacle and Asian currency crisis. If you've ever taken a course in logic or rhetoric then you are probably aware of the fallacy of reasoning known as “The Domino Fallacy.” If history provides any lessons for us, the current crisis will turn out to be yet another domino fallacy.
I normally don't put much emphasis on the weekly Investor's Intelligence sentiment poll since I find AAII to be more instructive in getting a read on short-term investor sentiment. Normally this is true since Investor's Intelligence measures what newsletter writers are saying, as opposed to what independent investors are feeling. However, during sustained down markets or protracted trading ranges, Investor's Intelligence has an advantage over AAII because this is when even the most perma-bull newsletter writers start questioning their faith in the stock market.
Recently, a study by Mike Burke and John Gray, published by Investors Intelligence, made the following observations:
“The sharp increase in advisor pessimism could be blamed on tumbling index action and the increased belief that the economy is in a recession….The spread between the bulls and bears is - 12.2%, a sharp drop from +5.3% a week ago. This is also the first negative difference since October 2002 ….”
Peter Eliades of Stock Market Cycles comments on this finding are worth repeating: “The plurality of bears over bulls today, an apparently meager 12.2%, is huge on a relative basis. It is the highest plurality of bears over bulls since October 11th, 2002 (14.8%). But before that, you have to go back to January 6th, 1995, to find another plurality of bears over bulls greater than today's reading of 12.2%. For over 13 years, there has been such a pent-up and persistent bullishness among advisers that this is only the second plurality of bears over bulls over 12% in the past 13 years.”
Now we come to the $64 million question: who will you listen to now? The “stopped clock” pessimists and media pundits who have been preaching financial doom and gloom since the last major bottom in 2002? They were correct from October 2007 to January 2008, but that's a mere drop in the bucket compared to the years they missed. If they're wrong about the 6-12 month outlook (and the evidence strongly suggests they are) then they'll end up giving back whatever gains were made from those four months, and then some more.
You can allow yourself to be influenced by the daily news headlines along with everyone else and be whipsawed left and right along the way. You can also choose to listen to the tape, which tells all. The market's message is undeniable in the face of terrible news and trader sentiment: it's holding its own in spite of the unending deluge of bad news and the internals are showing improvement on an actual basis as well as on a rate of change basis.
As the interim bottoming process continues, the market's undeniable message is that better days are ahead and with it will come an end to the endless stream of bad news and a better economic and financial market outlook. Are you prepared to take advantage of it?
By Clif Droke
www.clifdroke.com
Clif Droke is the editor of the three times weekly Momentum Strategies Report newsletter, published since 1997, which covers U.S. equity markets and various stock sectors, natural resources, money supply and bank credit trends, the dollar and the U.S. economy. The forecasts are made using a unique proprietary blend of analytical methods involving internal momentum and moving average systems, as well as securities lending trends. He is also the author of numerous books, including "How to Read Chart Patterns for Greater Profits." For more information visit www.clifdroke.com
Clif Droke Archive |
© 2005-2022 http://www.MarketOracle.co.uk - The Market Oracle is a FREE Daily Financial Markets Analysis & Forecasting online publication.


