Japanese Government Green Light to Crush Yen, How High Will U.S. Dollar Fly?
Currencies / Japanese Yen May 14, 2013 - 04:58 PM GMTBy: Gary_Dorsch
 The Wise Sages of Ancient days used to say, “The fate of a Liar, is that nobody believes him, - even when he’s speaking the truth!” Such is the predicament of Japan’s propaganda artists, including the Prime Minister, the Finance minister, and central bank chief, who are all trying to cover-up their boldest scheme yet, to crush the value of the Japanese yen, against the currencies of its major trading partners. On May 11th, the finance chiefs of the Group of Seven (G-7) gave Tokyo the green light to continue with its radical QE scheme, which has already led to a -24% devaluation of the yen against the US-dollar, and a -33% devaluation against the Euro, since market savvy traders first got wind of the plot in late November.
In an age when ruling coalitions of every political stripe distort the truth to promote their self interests, it’s hardly surprising that Japan’s ruling LDP party is steadfastly denying that it’s engaging in a “beggar thy neighbor” devaluation of its currency. By the same token, Tokyo’s fraudulent claim that its economy is still plagued by a negative rate of inflation (deflation), is so wildly at odds with reality that it’s routinely regarded with cynicism and disbelief.
On May 9th, the US-dollar’s exchange rate rose above the key threshold of ¥100 for the first time in 4-½-years, extending a +30% surge since mid November. The US-dollar’s advance didn't stop at ¥100, - it quickly surged to ¥102 the next day. The sharp move is just the latest episode in the mad scramble to dump the Japanese yen – as the BoJ unleashes its most radical scheme ever - “Big Bang” QE - designed to crush the yen’s exchange rate. It’s already dragged the Bank of Australia and the Bank of Korea into a regional currency war with Tokyo, with the Asian central banks cutting their loan rates last week, and hinting at more to come, trying to cap the rise of the Aussie dollar and the Korean won against the yen.
Tokyo’s “shock and awe,” - would double Japan’s monetary base from ¥135-trillion ($US1.4-trillion) to ¥270-trillion in two years. This will be achieved by stepped-up purchases of long-term government bonds (JGB’s) , and lifting the average maturity of its holdings from three to seven years. The BoJ will buy ¥7-trillion of JGB’s per month, - the equivalent of 1% of gross domestic product (GDP) every month for the remainder of 2013, and 1.1% per month in 2014. Given that Japan’s economy is one-third of the size of the US’s, the scope of Japan’s QE scheme is three times more potent than the Fed’s QE scheme.
Publicly, Tokyo insists that its radical scheme to double in the basic Japanese money supply over a period of 21-months is purely about trying to end two decades of prolonged deflation. Apparently, none of the G-7 finance chiefs criticized the BoJ’s monetary easing or the yen’s sharp devaluation, during the May 11th gathering - “Japan’s stance is gaining broader understanding,” Finance chief Taro Aso said at a joint press conference. “The BoJ isn’t targeting currency rates, which are determined by the markets,” added BoJ chief Haruhiko Kuroda. In Tokyo, Japanese PM Shinzo Abe added, “I’m not in a position to comment on an appropriate currency level. Basically, our policies are not aimed at weakening the yen. Various factors are behind exchange-rate moves. Among them, monetary policy plays a major one.” But he added “the BoJ's policy steps could indirectly result in a weaker yen and boost share prices, and help to lift corporate earnings,” Abe declared.
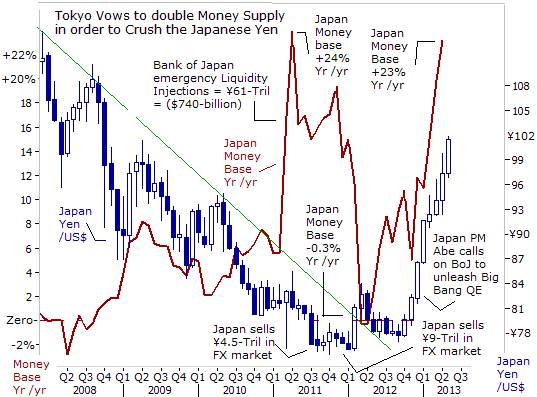
Japan to double Monetary Base, Here’s Tokyo’s sleight of hand, - a devaluation of a currency, whether deliberate or just a side-effect of QE, is still a tactical devaluation. The goal of Japan’s monetary policy is quite simple - boost the market value of the Nikkei-225 and Topix indexes by weakening the yen’s exchange rate. As noted in the Wall Street Journal, “The G-20 communiqué offered a message that “countries can continue to devalue their currencies so long as they don’t explicitly say they want to devalue their currencies. This contradiction between economic word and deed shows the degree to which policymakers have defaulted to easy money as the engine of growth. The rest is commentary,” the WSJ’s editors wrote.
“This monetary easing is in an entirely new dimension,” the newly installed BoJ chief Haruhiko Kuroda declared, following the bank’s April 4th decision. Kuroda emphasized the break with history, repeatedly pointing to a graph showing the planned jump in the country’s monetary base. “Incremental steps of the kind we’ve seen so far weren’t going to get us out of deflation. I’m certain we have now adopted all policies we can think of to meet the +2% price inflation target. And if prices did not rise as expected, the BoJ would not hesitate to step up the easing program,” Mr Kuroda warned. This radical stance represents a big sea change from his predecessors, who were faulted for being too ready to pull back from QE.
Prior to Mr Abe’s election victory in mid December, the BoJ kept a relatively tight rein on the monetary base. Under the guidance of BoJ chief Masaaki Shirakawa, Japan’s monetary base grew at +4% per year, on average, for the 5-year period ending in December of 2012. There was a brief spike in Japan’s monetary base in March of 2011, when the BoJ took emergency measures to protect the nation’s banking system in the wake of a crippling earthquake and ensuing tsunami. The BoJ injected a total of ¥60.6-trillion yen ($739-billion) into the Tokyo money markets, and increasing the monetary base by +23%. However, the short-term liquidity injections were allowed to fully expire, - draining the excess liquidity.
However, since Nov ’12, Japan’s monetary base has soared +11% to a record ¥150-trillion, and now stands +23% higher than a year ago. This time, nobody expects the latest increase in the money supply to be temporary or rolled back. The BoJ says it will increase the monetary base until it reaches a whopping ¥270-trillion. In turn, the tsunami of excess liquidity flowing from Tokyo is expected to crush the value of the Japanese yen against its trading partners, while fueling bubbles in global stock markets, via the infamous “Yen Carry” trade, which could grow in size to more than $1-trillion of highly leverage bets.
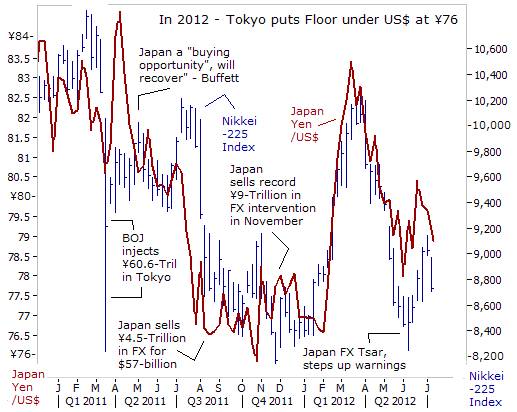
Japan abandons Older Policy of FX Intervention, adopts full scale QE, For Tokyo, the nuclear option of central banking – QE, - is working to crush the exchange rate of the yen, whereas its past policies of direct interventions in the foreign currency markets, mostly failed. Nearly 21-months ago, Japan injected ¥4.5-trillion into the currency markets, and bought $58-billion in one day’s work of intervention as it acted strongly to put a floor under the US$ at ¥76. Traders said the Bank of Japan intervened on behalf of the Ministry of Finance (MoF) on August 4, 2011, concentrating its firepower in the US-dollar against the yen. However, that intervention foray couldn’t even lift the US$ much above ¥79. A few months later, in Nov ’11, the US$ was sagging again, and tumbled to Tokyo’s red line in the sand at ¥76.
Japan is estimated to have injected ¥8-trillion on Oct 31st, 2011 alone, a daily record, and spent about ¥1 trillion in the days that followed in follow-up action probably intended to keep markets more on edge for fear of more big moves. The MoF admitted that it sold a record ¥9.1-trillion yen and bought $115-billion in currency intervention in the month through Nov 28th, 2011. The MoF still has sizable ammunition for intervention - it has parliamentary approval to borrow up to ¥37-trillion to be used for future yen-selling interventions. Although the US$ did rebound by ¥6 in Q’1 of 2012, to as high as ¥82.5 in March ’12, the rally soon fizzled out. By June of 2012, the US$ had fallen back again to ¥77.
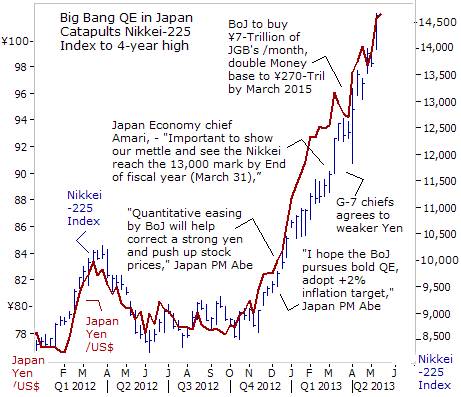
Tokyo Engineers big Nikkei Rally As a side note, on Mar 21st, 2011, corporate raider Warren Buffett made a bold prediction, saying that the devastating impact of the earthquake and tsunami to hit Japan’s economy, was the kind of extraordinary event that creates a buying opportunity for shares in Japanese companies. “It will take some time to rebuild, but it will not change the economic future of Japan. Frequently, something out of the blue like this, an extraordinary event, really creates a buying opportunity. I have seen that happen in the US, I have seen that happen around the world. I don’t think Japan will be an exception,” said the 80-year-old “Sage of Omaha” known for his long-term investing strategy. Buffet was correct, - a little more than two years later, the Nikkei-225 is surging towards the 15,000-level, up +56% from the 9,600-level that prevailed when Buffet made his prediction.
However, it was a very rocky road for the Nikkei-225’s recovery. Buffet’s Bullish prediction was placed in great doubt in May of 2012, when the Nikkei-225 fell to the 8,542-level, capping a -10% decline for the month. Short selling of Japanese stocks accounted for 32% of the total value of shares traded in the Tokyo Stock Exchange. The yen’s strength against the US-dollar and against the Euro in 2011 was crushing the income of Japanese Multi-Nationals’ earned from overseas. Sony earns 70% of its revenue outside Japan and Panasonic 48%. Japan’s biggest makers of phones, televisions and chips – Sony 6758.T, Panasonic 6752.T and Sharp 6753.T lost a combined $17-billion for the fiscal year, - the worst losses in their histories. Fitch Ratings lowered the debt ratings of both Sony and Panasonic one notch to BBB-, keeping both on negative outlook, while lowering the outlook on Sharp’s BBB- to negative, and was poised to downgrade all three companies to junk status in the next 12 months.
However, it’s a completely different outlook today. Thanks to Tokyo’s shift to Big-bang QE - Japan’s Nikkei-225 index has surged +75% higher since mid-November, reaching for 15,000, its highest level in 5-½-years. The earnings season is in full swing, and the yen’s fall enables Japanese exporters to earn more from foreign currency profits. On May 13th, blue-chip exporters soared, with Panasonic jumping +7.6% higher after saying its operating profit will likely jump +55% this fiscal year. Hitachi <6501.T> surged +7.8% after it forecast a +18.5% jump in operating profit for this fiscal year. For every 1-yen increase in the US-dollar’s value, - it leads to a +2.4% increase in Nissan Motor’s operating profit and +3.3% at Toyota Motor. Overall, Nikkei-225 companies’ operating profits are expected to rise +28% compared with a year ago, if the US-dollar can stay near ¥100.
BoJ aims to fuel Inflation by Crushing the Yen, On April 22nd – Japan’s central bank chief Kuroda reiterated that Japan’s Big-bang QE scheme would continue until Japan achieves a +2% inflation rate. Mirroring Kuroda’s views, Finance chief Taro Aso said the yen’s weakness is a “byproduct of QE,” but the ultimate aim is to end deflation and boost economic growth. “My position is that the yen’s decline may have resulted from our policies, but the aim of our policies is to escape deflation. Yen weakness is a byproduct,” he explained.
Crushing the value of the yen is about the only mechanism that Tokyo has readily available in order to boost Japan’s inflation rate to +2%. That’s a pretty tall order, since Tokyo massages its inflation data, and uses fuzzy math to calculate its cost of living index. The methodology is completely under the control of Tokyo’s financial warlords, and the inflation data is routinely rigged to show a perpetual pattern of deflation. Last week, Japan said its consumer price index was -0.9% lower in April, compared with a year earlier.
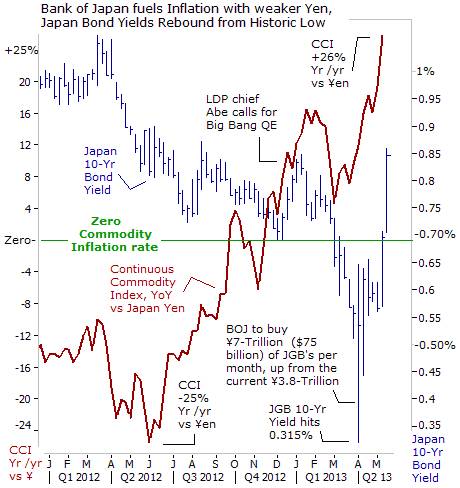
Once every five years, the Japanese government revises the basket of products used to derive its consumer price index to better reflect trends in household spending. Government apparatchiks routinely remove the goods and services that are increasing in price from the index, and replace them with goods and services that are falling in price. At the last revision in July ’11, Tokyo shaved -0.75% off its CPI rate. Five years earlier, it shaved -0.50% off its CPI. In other words, the brazen BoJ could triple its money supply, before Tokyo would ever admit that its inflation rate has reached +2% that’s common everywhere else in the world.
BoJ chief Kuroda sounded confident on May 11th that the central bank could prevent an upward spike in Japanese bond yields. “I do not expect a sudden spike in long-term bond yields. In the long-run, if the economy recovers and inflation heads towards +2%, we might see nominal interest rates rise but that’s natural.” The rigging of Japan's CPI data is to be expected, so JGB traders should only trust the actual prices in the global commodity markets for real-time clues about the future direction of inflation, and not rely on doctored-up government statistics.
Despite Kuroda’s belief that the BoJ can easily continue to manhandle Japan’s $10.5-trillion government bond (JGB), some market investors are starting to question the wisdom of owning ultra-low yielding JGB’s. On May 13th, ten-year JGB futures price posted its biggest three-day drop in 2-½-years, and skidded to a 1-year low. The Tokyo Stock Exchange briefly suspended JGB trading as a circuit breaker was triggered. The 10-year cash bond yield shot upwards to as high as 0.86%, extending its biggest surge in 5-years.
JGB yields initially plunged in a knee-jerk reaction to a historic low of 0.315% upon hearing the details of the BoJ’s scheme to purchase of ¥7.5-trillion of JGB’s each month, which might lead to a scarcity of bonds. But it did not take a single day for the market to reverse course. The 10-year yield is now more than 2.5-times as high as it record low of 0.315% hit on April 4th. As part of its two-year Big-bang QE, the BoJ bought ¥1.2-trillion of bonds on May 13th, but that failed to stop the uptick in JGB yields to 0.86%. Still, for Nikkei bulls, - there’s no need to panic - as the 10-year yield is still comfortably below 1%.
How long can Tokyo’s financial warlords continue brainwash the Japanese public into believing that the bogeyman of deflation is still haunting its economy? No doubt, MoF apparatchiks will continue to fudge the official inflation numbers. However, the truth is, - the Continuous Commodity Index, measuring the cost of a basket of 17-equally weighted commodities, is now trading +26% higher than a year ago, when priced in yen. A further weakening of the yen would only increase the cost of imported goods for Japanese consumers. Already, the cost for imported fossil fuels jumped +10% last year to ¥24-trillion, even before the US$ crossed ¥90. Be careful of what you wish for, since a higher cost of living can sap the disposable income of your citizens, and lift JGB yields, which in turn, can also cause an economic recession.
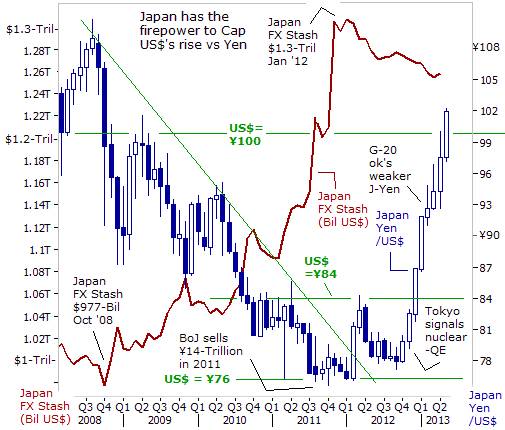
How high can US$ fly, versus Yen? If the yen begins to plummet into a free-fall, Japan’s competitors in China, Germany, Korea and the US might cry foul and demand that Tokyo either scale back its Big-bang QE operations or stop them completely. Otherwise, other central banks might push back against Tokyo in a full scale currency war, the likes of which, the world has never seen before. However, Tokyo is confident it can prevent a free-fall of the yen, and that it can carefully orchestrate a gradual devaluation, with verbal Jawboning exercises and utilizing its enormous war chest of foreign currency reserves, now totaling $1.26-trillion, and mostly consisting of US-dollars.
Although Japan is supposed to refrain from using its FX reserves for purposes of direct intervention in the currency markets, according to the Feb 12th G-20 communiqué, the renegade BoJ is expected to begin clandestine sales of US-dollars at higher levels, in order to keep a two-way market intact, and prevent a currency free-fall. Where would Tokyo try to cap the US-dollar’s advance? On January 18th, Koichi Hamada, the chief architect of “Abenomics,” gave a subtle hint to reporters at the Foreign Correspondents’ Club of Japan in Tokyo, saying the US-dollar can rise to ¥110 before excessive inflation risks kick in. “If the US-dollar goes above ¥110, there may be reason for worry,” he said, signaling that Tokyo would try to engineer a rally for the US-dollar in staggered step patterns, - gaining about ¥3 and pulling back ¥1, until it reaches ¥110.
This article is just the Tip of the Iceberg of what’s available in the Global Money Trends newsletter. Subscribe to the Global Money Trends newsletter, for insightful analysis and predictions of (1) top stock markets around the world, (2) Commodities such as crude oil, copper, gold, silver, and grains, (3) Foreign currencies (4) Libor interest rates and global bond markets (5) Central banker "Jawboning" and Intervention techniques that move markets.
By Gary Dorsch,
Editor, Global Money Trends newsletter
http://www.sirchartsalot.com
GMT filters important news and information into (1) bullet-point, easy to understand analysis, (2) featuring "Inter-Market Technical Analysis" that visually displays the dynamic inter-relationships between foreign currencies, commodities, interest rates and the stock markets from a dozen key countries around the world. Also included are (3) charts of key economic statistics of foreign countries that move markets.
Subscribers can also listen to bi-weekly Audio Broadcasts, with the latest news on global markets, and view our updated model portfolio 2008. To order a subscription to Global Money Trends, click on the hyperlink below, http://www.sirchartsalot.com/newsletters.php or call toll free to order, Sunday thru Thursday, 8 am to 9 pm EST, and on Friday 8 am to 5 pm, at 866-553-1007. Outside the call 561-367-1007.
Mr Dorsch worked on the trading floor of the Chicago Mercantile Exchange for nine years as the chief Financial Futures Analyst for three clearing firms, Oppenheimer Rouse Futures Inc, GH Miller and Company, and a commodity fund at the LNS Financial Group.
As a transactional broker for Charles Schwab's Global Investment Services department, Mr Dorsch handled thousands of customer trades in 45 stock exchanges around the world, including Australia, Canada, Japan, Hong Kong, the Euro zone, London, Toronto, South Africa, Mexico, and New Zealand, and Canadian oil trusts, ADR's and Exchange Traded Funds.
He wrote a weekly newsletter from 2000 thru September 2005 called, "Foreign Currency Trends" for Charles Schwab's Global Investment department, featuring inter-market technical analysis, to understand the dynamic inter-relationships between the foreign exchange, global bond and stock markets, and key industrial commodities.
Copyright © 2005-2013 SirChartsAlot, Inc. All rights reserved.
Disclaimer: SirChartsAlot.com's analysis and insights are based upon data gathered by it from various sources believed to be reliable, complete and accurate. However, no guarantee is made by SirChartsAlot.com as to the reliability, completeness and accuracy of the data so analyzed. SirChartsAlot.com is in the business of gathering information, analyzing it and disseminating the analysis for informational and educational purposes only. SirChartsAlot.com attempts to analyze trends, not make recommendations. All statements and expressions are the opinion of SirChartsAlot.com and are not meant to be investment advice or solicitation or recommendation to establish market positions. Our opinions are subject to change without notice. SirChartsAlot.com strongly advises readers to conduct thorough research relevant to decisions and verify facts from various independent sources.
Gary Dorsch Archive |
© 2005-2022 http://www.MarketOracle.co.uk - The Market Oracle is a FREE Daily Financial Markets Analysis & Forecasting online publication.


