Stock Market FTSE 100 Sending Red Warning Flag Signals
Stock-Markets / UK Stock Market Apr 14, 2013 - 06:56 PM GMTBy: Michael_Noonan
 One of the best aspects of reading developing market activity is that it reduces any market to the opposing forces of supply and demand. It can be any organized market, anywhere. The factors of fear and greed universally apply to all investors/traders.
Reading developing market activity, in context with past price behavior, is a short- hand way to follow what smart money is doing. Smart money represents the controlling influences behind price movement. We recently did an analysis on the German DAX, [Different Country, Different Culture. People Are People, Charts Are Charts, http://bit.ly/ZDvxeg]. What held true for that analysis equally holds true for the FTSE 100.
The starting point for any analysis is defining the trend and doing it on a higher time frame to put a market into a context for decision-making. The market sends out a lot of information, captured in the bar ranges and location of the closes on a bar. The size of the range indicates the level of strength/weakness of price movement. The close tells us who won the battle for that session, whether it is monthly, weekly, daily, or intra day time frames.
Smart money does not like to let it be known what its intent is when in the market, but their hand can be detected by reading the developing market activity and the volume behind the effort. Neither the FTSE nor the DAX provide volume, so an important element is eliminated. As with any market, you learn to deal with what is.
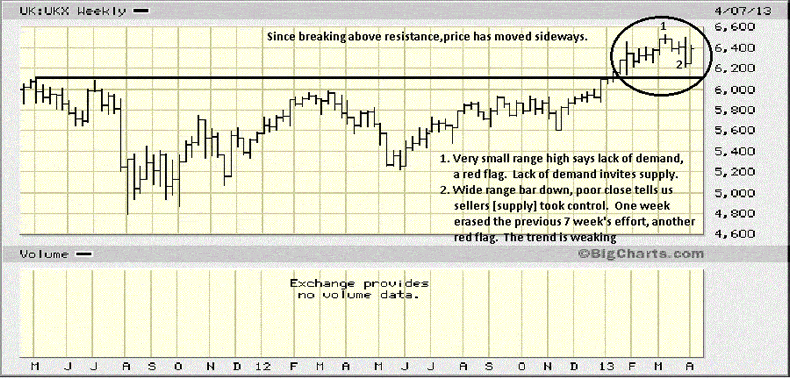
The 2007 high is obvious and important. After a labored rally since the 2009 lows, much of which was spent in a sideways movement for three years, there was a strong rally breakout in January, fourth bar from the right. The last three bars are the focus of attention. We need to determine if the market is absorbing seller efforts, or if the effort of sellers is overcoming that of buyers. A look at the more detailed weekly may provide that answer.
The trend has been up since 2009, already identified as relatively labored, so we know that buyers have proven themselves, and the onus for a change in trend is on the sellers. The character of the weekly chart should also help in determining the quality of the trend.

Right away, it becomes apparent that the quality of the trend is not strong. Price has moved sideways since the late January breakout. The message from the market also alerts us to a lack of demand bar at 1. The very small size of the bar tells us there was a decided lack of demand, demonstrated by the inability to extend the range higher. Occurring at the high of the rally, and under monthly resistance, the market is signaling a red flag warning.
Prior to bar 2, six of the previous 8 ranges had weak closes, yet more factual information provided by the market that speaks to the character, or quality of the trend. Contrast those bars with the one labeled 2. It shows Ease of Downward Movement, [EDM], and a low-end close. That one bar also erases the buying effort of the February and March, a second red flag warning.
Where are the buyers? An apparent lack of demand is noted by and invites sellers to step in and take over.

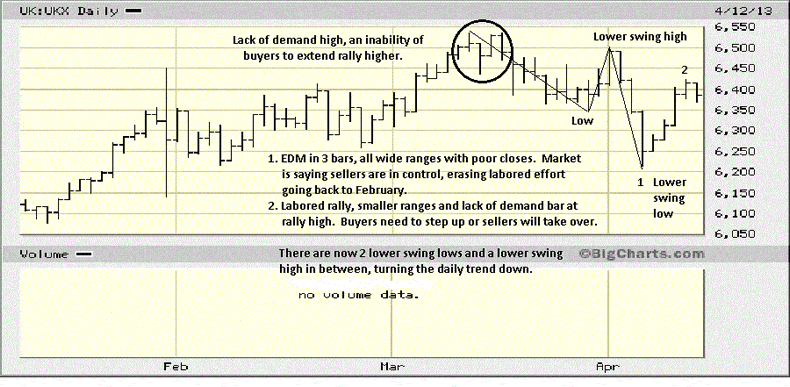
The possible negative tone set by the monthly was reinforced on the weekly. We can expect to see clearer detail of the same on the daily, and it does not disappoint. The lack-of-demand March high leads to a correction, but it stops within the supporting trading range activity from February. When price fails to rally to new highs, a lower swing high is created. What follows that high is another warning message.
We see EDM, three wide ranges lower with weak closes, erasing the past two months' entire buying activity. The ability of price to slice through so quickly is the market telling us that the buying effort during February and March was of a poor quality. A new swing low follows the lower swing high, and by definition, the daily trend has turned down, at least for now.
The next rally stops at 2, not quite confirmed, but Friday's lower high, lower low, and lower close will likely lead to more selling on Monday.
The monthly and weekly time frames remain up, not strongly, but still up. The lack of strength is attracting sellers to step in and take control. Temporarily, that control has been wrested away on the daily chart. There is still some support in the 6150 area, and how price responds to it, should it be tested, will provide more important information.
For now, the demonstrated weakness is a sign of caution. One needs to take an inventory of holdings to see if there are stocks even weaker, and they should be either sold or have close stops to keep risk exposure contained. The same would hold true for one's entire portfolio. Profit-taking may ease potential erosion should the apparent price weakness show no ability to attract more demand.
An analysis like this makes decision-making more pragmatic, using the available factual information generated by the market, always the final arbiter. The emotional element is removed and reduced to dollars and cents, or pounds and sense. It appears that is what the smart money is doing.

By Michael Noonan
Michael Noonan, mn@edgetraderplus.com, is a Chicago-based trader with over 30 years in the business. His sole approach to analysis is derived from developing market pattern behavior, found in the form of Price, Volume, and Time, and it is generated from the best source possible, the market itself.
© 2013 Copyright Michael Noonan - All Rights Reserved Disclaimer: The above is a matter of opinion provided for general information purposes only and is not intended as investment advice. Information and analysis above are derived from sources and utilising methods believed to be reliable, but we cannot accept responsibility for any losses you may incur as a result of this analysis. Individuals should consult with their personal financial advisors.
Michael Noonan Archive |
© 2005-2022 http://www.MarketOracle.co.uk - The Market Oracle is a FREE Daily Financial Markets Analysis & Forecasting online publication.


