


U.S. Non Farm Payrolls Report - Interesting Seasonality Factors
Economics / Employment Apr 07, 2013 - 11:28 AM GMTBy: Jesse

 As you may recall, the raw input into the Non Farm Payrolls report is the actual count of jobs which the BLS compiles.
To this number the BLS adds the output of the Birth-Death Model, which is their estimate of Jobs lost and created by new businesses not included in the report.
And finally, there is the 'seasonally adjusted number.' That is a factor which is applied to the actual count plus BD Model to arrive at what might be considered a steady state or deseasonalized number.
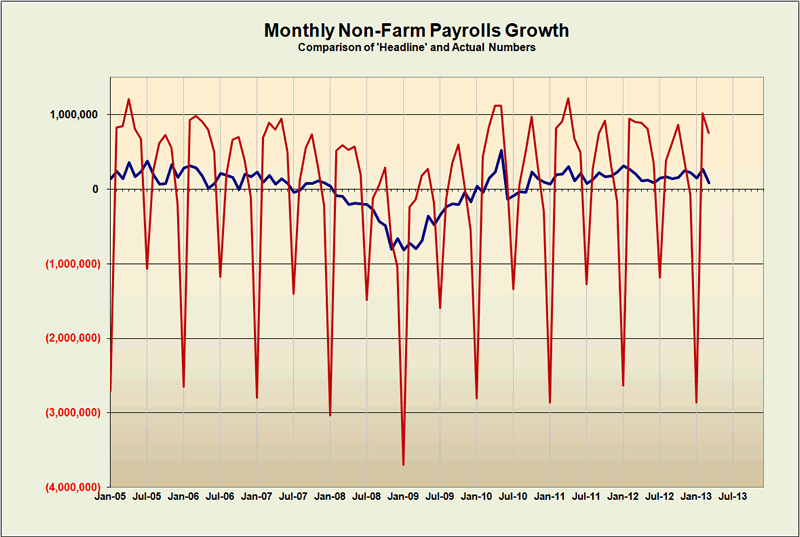
Take a look at the chart below. The line in red is the actual number plus BD model. There are wide swings in the number of jobs added or subtracted based on the changes in the seasons. This is how many economic data present themselves.
For purposes of analysis, economists and statisticians use tools to try and take out the 'seasonality' and provide a number that shows what the change would be if the changes caused by seasonal variation are taken out.
The result is the Seasonally Adjusted number, which is the blue line on the chart below.
As you can see in some months the adjustment is to take jobs out of the actual number, and in other months it is to add jobs to that number. Sometimes those adjustments are very large, and in other months rather modest.
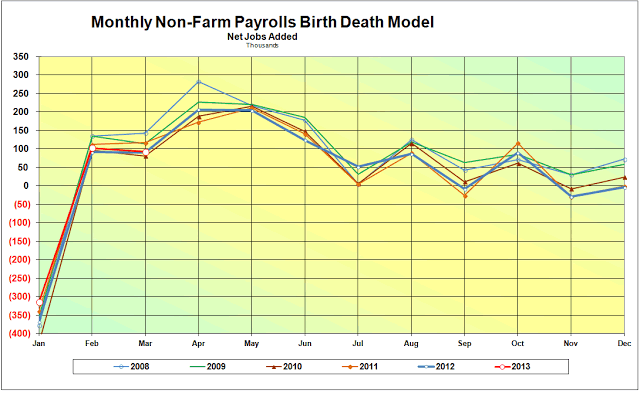
I am including the Birth Death model numbers which I also watch each month and compare to the results from past years. There is nothing untoward here, but people will almost certainly ask about it. It is important to remember that these numbers are added into the actual number BEFORE the seasonal adjustment is applied.
The next chart shows the actual seasonality factor which has been used for a given month. It is just a simple mathematical calculation to show the change which had been applied to the actual number plus BD model input.
I include the results from a number of past years so I can see how the factor used this year compares to factors which have been used by the BLS in other years.
The result is shown below. The current year is graphed with red lines with open circles at the data points.
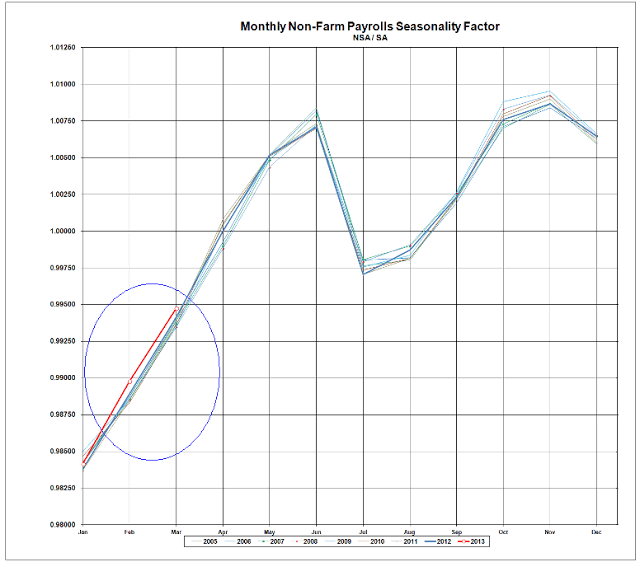
I think it is interesting that this year is drifting out of the normal factor range. This means that BLS is adjusting the actual numbers to a greater degree than they might have ordinarily done in the past. The adjustment factor is not large, but remember that it is being applied to a raw number of millions of jobs.
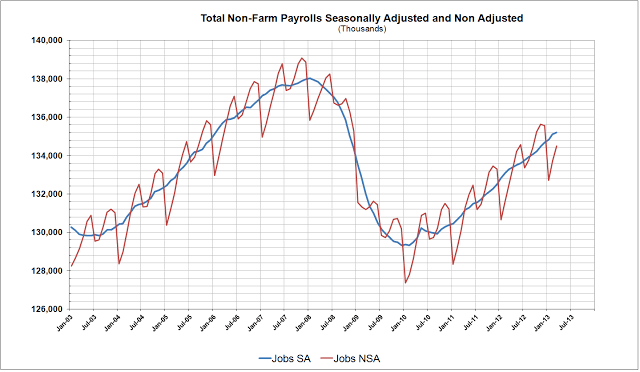
Here is another view of the relationship between the seasonally adjusted and non seasonally adjusted total numbers.
It is also important to remember that the BLS normally revises the prior two months whenever they issue a new estimate, so the factors we see on this chart for 2013 may be changed over the next couple of reports.
However I thought it was a trend worth watching. I had been wondering if the BLS would use a 'conservative' approach in their 'headline announcement' this month which might reflect the impact of sequestration, and provide some context for President Obama's budget which he is just releasing.
Is this too Machiavellian? Perhaps. But I like to watch the reports and see if any trends appear. And you know how adverse I am to drawing broad conclusions from just a few data points. I think the headline numbers are mostly useful for news sound bites and Wall Street price shenanigans. The truth is in the trends, and I prefer a nine month moving average.
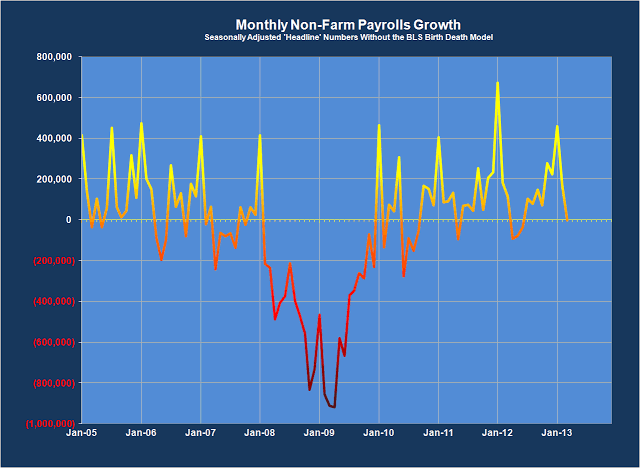
In case you were wondering, here is what the Jobs numbers would look like if there was no Birth-Death model. I subtract the BD numbers out after applying the seasonality factor to them.
As you can see, the data is rather 'noisy' to say the least.
Just something to think about. I do these calculations every month for the NFP. I will keep an eye on them in the future and advise you of anything interesting.
And as a reminder, one must look at other data points outside the Non-Farm Payrolls report to get a clearer picture of what is going on.
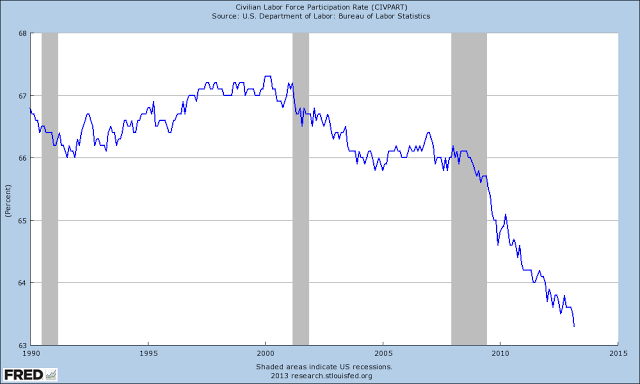
One of my favorite additional reports is the Labor Participation Rate. This represents the actual number of potential workers being counted as a percentage of all the people. This is important because the statisticians tend to discard people as potential workers if they have been unemployed over a certain period of time.
This can make one of the other headline numbers, the unemployment rate, look much better than it really is during severe downturns with abnormally long periods of unemployment. And this is what we are in today.
Since this is budget and sequester season in Beltway Land I am paying particular attention to any numbers which they show. Numbers paint pictures, and where there are large adjustments there is latitude, and often liberties taken with them. This is the human condition.
By Jesse
http://jessescrossroadscafe.blogspot.com
Welcome to Jesse's Café Américain - These are personal observations about the economy and the markets. In plewis
roviding information, we hope this allows you to make your own decisions in an informed manner, even if it is from learning by our mistakes, which are many.
© 2013 Copyright Jesse's Café Américain - All Rights Reserved
Disclaimer: The above is a matter of opinion provided for general information purposes only and is not intended as investment advice. Information and analysis above are derived from sources and utilising methods believed to be reliable, but we cannot accept responsibility for any losses you may incur as a result of this analysis. Individuals should consult with their personal financial advisors.
Jesse Archive |
© 2005-2022 http://www.MarketOracle.co.uk - The Market Oracle is a FREE Daily Financial Markets Analysis & Forecasting online publication.