Stock Market Hit by "V" for Vendetta Long-term Pattern
Stock-Markets / US Stock Markets Mar 10, 2008 - 01:23 PM GMTBy: Joseph_Russo
 V for Vendetta is a 2006 film set in a dystopian future United Kingdom, where “V”, a mysterious anarchist wearing a Guy Fawkes costume, works to bring down an oppressive fascist government, profoundly affecting the people he encounters.
The following are some notable quotes from the film:
 “Artists use lies to tell the truth, while officials use lies to cover-up the truth.”
“ People should not be afraid of their governments - governments should be afraid of their people.”
“This may be the most important moment of your life - commit to it.”
“The only verdict is vengeance; a vendetta, held as a votive, not in vain, for the value and veracity of such shall one day vindicate the vigilant and the virtuous.”
The Broad market update
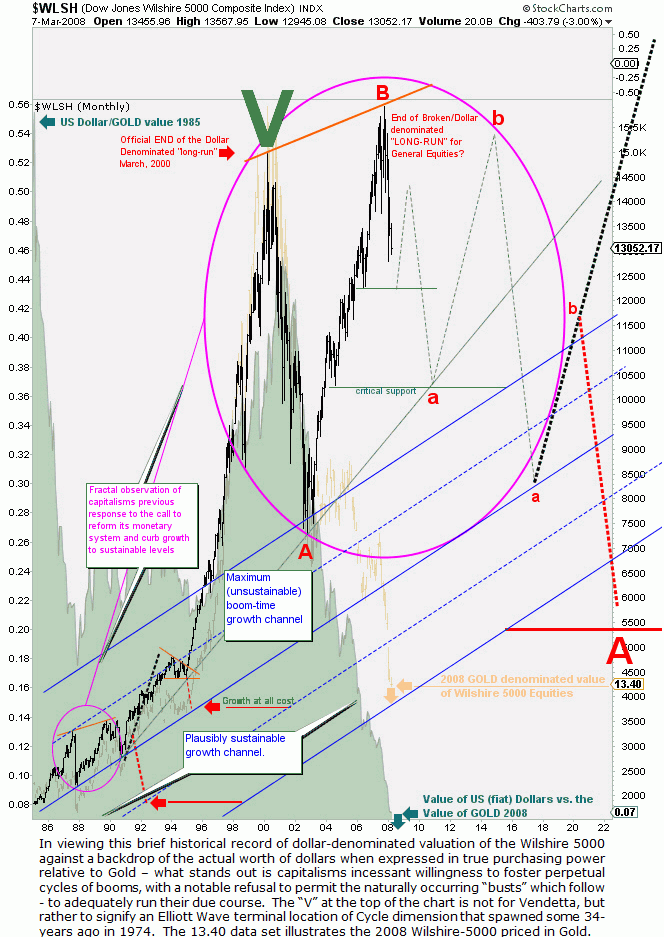
This broad market update begins with a long-run value perspective of US equities. The chart of the Wilshire 5000 index illustrates the broadest measure of US stocks. Although we may hold a minority opinion that the “long-run” for US equities ended some eight years ago, we trust that such views are plentifully shared by a wide range of astute market observers, and more recently by a growing contingent of the public at large.
Is the Long-Run OVER for US Equities? 
History's most essential lesson – perpetually dismissed
It is abundantly clear that flexible, floating-fiat-currencies are neither practical nor stable. Nor do they foster sustainable long-term growth, or full employment. Furthermore, they incite - rather than contain inflation. Thousands of years of history have proven that in truth, all fiat currencies will unequivocally, and without exception - sink rather than float - to their intrinsic value of ZERO – it is merely a function of time.
Hope for the 21 st Century
Optimistically, we assume that sooner or later, civilization at large will one day learn this critically essential lesson of history in order to end humankind's vicious cycle of ignorant insistence upon making the same mistakes over and over again. There is no practical reason or excuse why humankind should continue to repeat this most critical and obvious mistake with such predictive cyclicality, consequence, and threat of inevitable demise. In the process of such epic slow-motion drama, only a select few with enhanced vision are able to accurately anticipate and time the various stages of effect and development to an otherwise deceptive and perplexing set of dynamic variables.
“ T ” for Technician = (“ V ” for Vision + “ P ” for Profits )
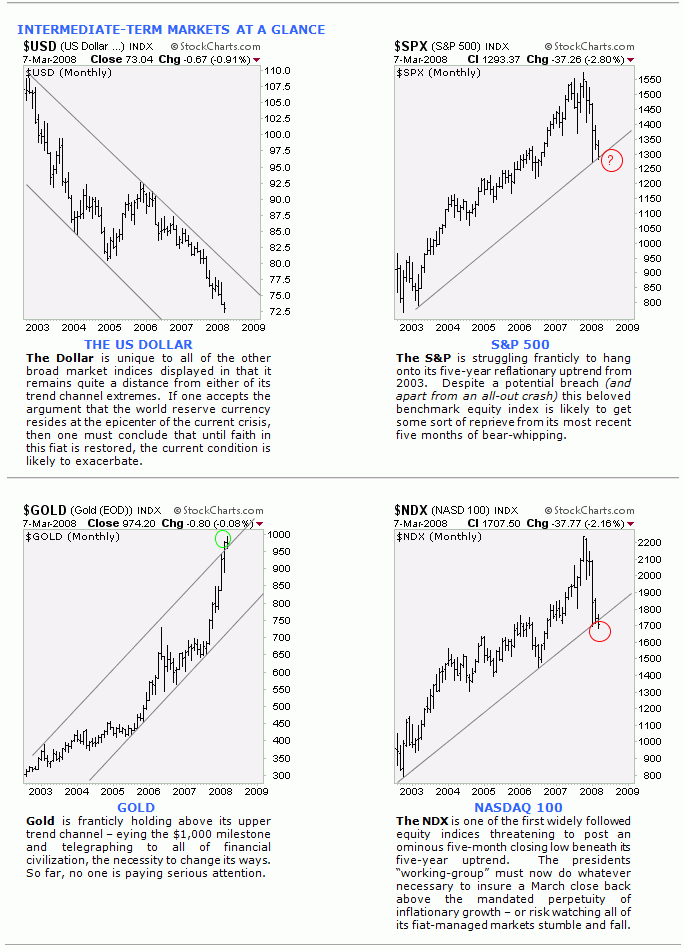
Many market technicians use an integrated array of price data comparisons to help illuminate the truth while forecasting future values for dollar or fiat-paper-denominated assets. Whether by complicit self-interest design, or by the sheer ignorance of plausible denial, not only do institutionalized mainstream economists, politicians, wall-street-innovators, and monetary authorities limit themselves to the express use of fiat-denominated price data from which to plan the course of countries, but they further use this alarmingly flawed benchmark of instable weight and measure to contrive valuations, and pronounce frequent status reports as to the current and projected fiscal state of affairs as it may concern and relate to their supportive citizenry.
What are they thinking?
Talk about fairytales, this type of official, worldwide long-term planning and forecasting, which is based exclusively upon a fragile foundation, and from the illusory prism of an egregiously faltering fiat-denominated architecture, is nothing short of a delusional recipe for inevitable disaster. In modern Real-Estate terms, we suspect the current systemic rot is extremely close to being classified as a “tear-down.” At some point in time, something of former value erodes to such a level of decay that it can no longer benefit from fixes or reparations. When that time comes, the item of former value is intentionally demolished, and blueprints for a new architecture of durable integrity is crafted to take its place. If left unattended, such structures will eventually implode on their own – leaving their former inhabitants either fatally wounded, or with no resource for shelter or sustenance. If we got a man on the moon in the 20 th Century, we can certainly figure out a way to redesign and properly maintain a sustainable financial system for the 21 st Century and beyond.
Making REAL fortunes / short & long-term
Whether one trades for speculative profit, or invests for the long-haul, it is to their utmost advantage, and critically essential to cross-check ones personal or professional vision of anticipated future values against that of an impartial visionary chartist. Preferably, one who can accurately take into account and forecast the nuance and price patterns within various broad data sets - both in real and fiat-denominated terms. Whether one seeks to amass fiat-denominated profits through trading, or preserve real-wealth through proper allocation of resources – a second opinion is well worth the effort.

Cross-Checking Speculative and Position-Oriented Commitments
Whether one is trading a personal account, or moving substantial size as a professional trader or manager of funds, it is expressly understood that an abundance of work and preparation must be acquired and diligently maintained toward assuring a positive outcome to such complex and challenging endeavors. Amid the zero-sum terrain of “winner-take-all,” it is nearly impossible not to become emotionally biased towards ones analytical conclusions, embracing strongly in the belief that the desired outcome of preference regardless of one's size/time horizon – will pan out as planned.
Although a variety of effective tools and vast pools of institutional resources may be readily available to traders and professionals alike - one should nonetheless seriously consider the benefits of cross-checking ones analytical work, perceptions, and assumptions with that of an alternate reliable source of study. At worst, ones conclusions and assumptions may be confirmed. At best, one may discover additional areas from which to profit, and/or relevant alternate perceptions that may not have been considered, or factored into one's prior analysis.
Comparing Notes and Homework
The express focus of Elliott Wave Technology's charting and forecasting services is to keenly observe, monitor, and anticipate the future course of broad market indices over the short, intermediate, and long-term. Each broad data-set under study, whether an intraday 30-minute price chart, or a yearly bar chart spanning as far back as 1896, is assessed by its current and historical face-value regardless of composition changes, or underlying currency dynamics.
Traditional charting protocols are vigorously observed, in concert with classic application and adherence to the exceptionally accurate navigational benefits provided by the proper application and classic tenets of Elliott Wave Theory. Although Elliott Wave Theory is by no means a trading system, it is the best tool - bar-none, from which to anticipate directional guidance accurately across all time horizons.
Classic charting protocol regularly disseminated includes:
• pattern recognition with accompanying price-targets
• proprietary counter-trend over-bought/over-sold assessments
• dynamic trendlines of support and resistance
• specific trade-triggers with price-objectives
• Fibonacci turn-bar tendencies and observations
Markets Covered Publication Frequency Time-Horizon/Data-Sets
• US dollar NTO 2x per week (daily, weekly, monthly)
• Dow NTO 5x per week ( intraday , daily, weekly, monthly)
• S&P 500 NTO 5x per week ( intraday , daily, weekly, monthly)
• Gold NTO 2x per week (daily, weekly, monthly)
• GLD streetTracks NTO 2x per week (intraday, daily, weekly, monthly)
• HUI NTO 2x per week (daily, weekly, monthly)
• NDX 100 NTO 5x per week ( intraday , daily, weekly, monthly)
• Crude Oil NTO 2x per week (daily, weekly, monthly)
• 20-yr Bond Yields IMF Monthly (monthly)
• CRB IMF Monthly (monthly)
• Emrgng. Mrkt. Index IMF Monthly (monthly)
• NYSE Composite IMF Monthly (monthly)
• NASDAQ Composite MWQR Quarterly (monthly)
• Silver MWQR Quarterly (monthly)
• Canadian Dollar MWQR Quarterly (monthly)
• Australia 's ASX MWQR Quarterly (monthly)
• Shanghai Composite MWQR Quarterly (monthly)
• Russia 's RTSI MWQR Quarterly (monthly)
• India 's BSE Sensex MWQR Quarterly (monthly)
• Brazilian Bovespa MWQR Quarterly (monthly)
• Mexican Bolsa MWQR Quarterly (monthly)
• Japan 's Nikkei MWQR Quarterly (monthly)
• London 's FTSE MWQR Quarterly (monthly)
• French CAC MWQR Quarterly (monthly)
• German DAX MWQR Quarterly (monthly)
• DJ World Index MWQR Quarterly (monthly)
Short-Term Trading Environment: Week ending 7-Mar.
In short … Improving and Profitable

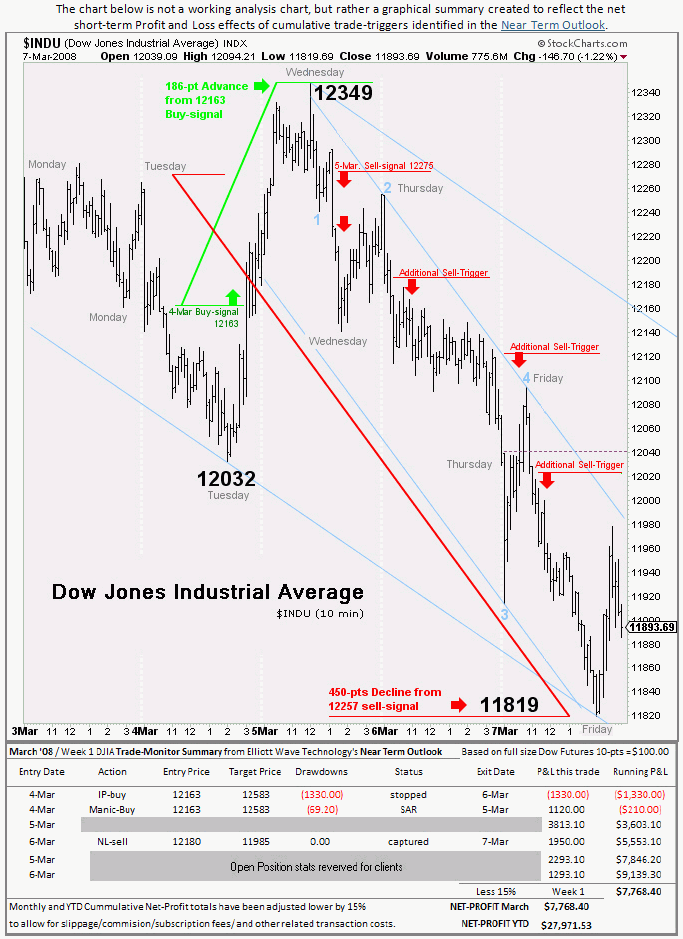
As our short-term trading chart for the Dow illustrates, we opened the week on Tuesday seeking long exposure following oversold conditions that had been building from the prior week.
Though the timing of this short-term signal was generally accurate - delivering as much as 186 points of advance from its issuance, from a practical real-world trading standpoint – it failed to adequately follow through in generating acceptable levels of profit, and was soon stopped and reversed to the short-side on Wednesday.
From Wednesday forward, it was all down-hill both literally and figuratively. All told, the short-term trade summary for the week ending 7-February, recorded gross profits in excess of $9,000US.
Should one have interest in acquiring access to our long-term technical analysis and/or utilizing our proprietary short-term market landscapes, we invite you to visit our web-site for more information. For immediate access to our broad market coverage in all time-horizons, one may subscribe directly to the Near Term Outlook .
Trade Better / Invest Smarter...
By Joseph Russo
Chief Editor and Technical Analyst
Elliott Wave Technology
Copyright © 2008 Elliott Wave Technology. All Rights Reserved.
Joseph Russo, presently the Publisher and Chief Market analyst for Elliott Wave Technology, has been studying Elliott Wave Theory, and the Technical Analysis of Financial Markets since 1991 and currently maintains active member status in the "Market Technicians Association." Joe continues to expand his body of knowledge through the MTA's accredited CMT program.
Joseph Russo Archive |
© 2005-2022 http://www.MarketOracle.co.uk - The Market Oracle is a FREE Daily Financial Markets Analysis & Forecasting online publication.


