Weekly Stock Market Technical Analysis Report - 24th Feb 07
Stock-Markets / Forecasts & Technical Analysis Feb 24, 2007 - 02:18 PM GMTBy: Mike_Burk
The good news is: All of the major averages hit all time or multiyear highs last week.
Short Term
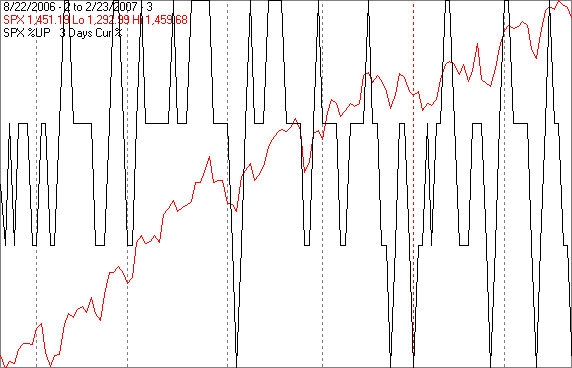
The picture is mixed. The S&P 500 (SPX) fell for 3 consecutive days after hitting a multiyear high last Tuesday.
The chart below covers the last 6 months showing the SPX in red and an indicator that shows the percentage of the last 3 trading days that were up in black. In the past 6 months the SPX has not fallen for more than 3 consecutive days. Except for the occurrence at the end of last year, each time there have been 3 consecutive down days it marked a short term low.

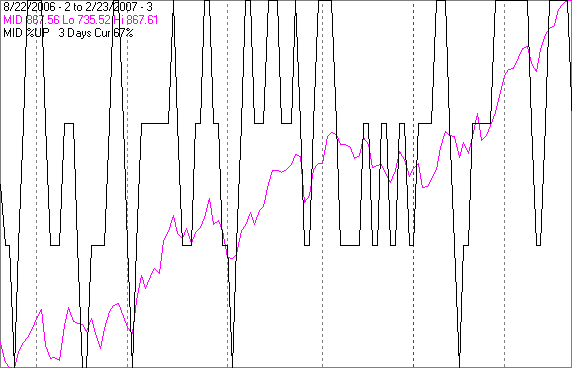
The real champ in this rally has been the S&P mid cap index (MID). After moving up for 10 consecutive days in late January and early February the index declined for 2 days then rallied for another 7 consecutive days ending last Thursday.
The chart below is similar to the one above except it shows the MID index.

The short term outlook is a little cloudy. The SPX measured by consecutive down days is oversold while the MID is about as overbought as it has ever been.
Intermediate term
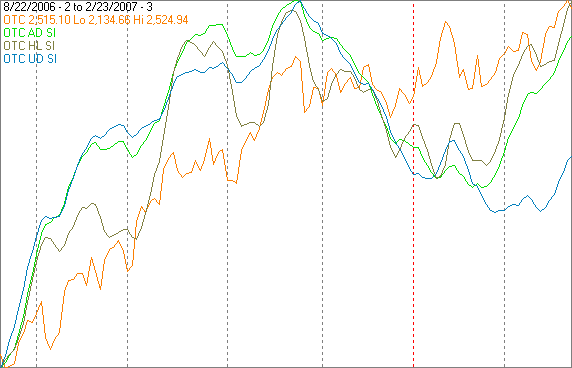
Summation indices (SI) are a running total of oscillator values. When the oscillator is positive the SI rises and when it is negative the SI falls.
The next chart covers the last 6 months showing the NASDAQ composite (OTC) in red and SI's calculated from NASDAQ advancing - declining issues, new highs - new lows and upside volume - downside volume.
Most of the market's gains have been made while the SI's have been moving upward and right now they are all moving upward.

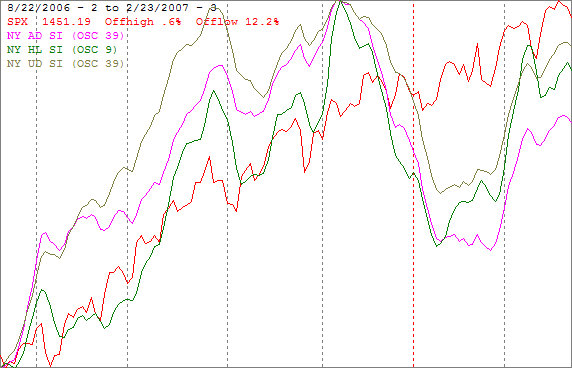
The next chart is similar to the one above except the index is the SPX and the SI's have been calculated from NYSE data. All of the NYSE SI's turned downward last week.

Seasonality
Next week includes the last 3 days of February and the first 2 days of March during the 3rd year of the Presidential cycle.
The tables below show OTC data from 1963 - 2003 during the 3rd year of the Presidential Cycle and SPX data beginning with 1931.
There are summaries for both the 3rd year of the Presidential Cycle and all years combined.
Next week has had a modestly positive bias by most measures. During the 3rd year of the Presidential Cycle the SPX has been up a little less than half of the time (47%) but has had a modest gain (0.14%) over the period.
Last 3 days of February and first 2 days of March.
The number following the year represents its position in the presidential cycle.
The number following the daily return represents the day of the week;
1 = Monday, 2 = Tuesday etc.
| OTC Presidential Year 3 | ||||||
| Year | Mon | Tue | Wed | Thur | Fri | Totals |
| 1963-3 | -0.58% 2 | 0.10% 3 | -0.52% 4 | -0.68% 5 | -0.23% 1 | -1.91% |
| 1967-3 | 0.76% 5 | 0.02% 1 | -0.86% 2 | 0.48% 3 | 0.56% 4 | 0.95% |
| 1971-3 | 0.92% 3 | 0.59% 4 | 0.11% 5 | 0.43% 1 | 0.06% 2 | 2.11% |
| 1975-3 | 0.24% 3 | 0.40% 4 | 0.65% 5 | 1.14% 1 | 0.51% 2 | 2.94% |
| 1979-3 | -0.11% 1 | -1.81% 2 | -0.07% 3 | 0.63% 4 | 0.28% 5 | -1.08% |
| 1983-3 | 0.89% 4 | 0.05% 5 | -0.67% 1 | 0.44% 2 | 0.60% 3 | 1.31% |
| Avg | 0.54% | -0.15% | -0.17% | 0.62% | 0.40% | 1.25% |
| 1987-3 | 0.87% 3 | 0.24% 4 | 0.70% 5 | -0.25% 1 | -0.08% 2 | 1.47% |
| 1991-3 | -0.75% 2 | 0.69% 3 | 0.49% 4 | 0.81% 5 | 0.96% 1 | 2.22% |
| 1995-3 | -0.03% 5 | -0.83% 1 | 1.18% 2 | -0.23% 3 | 0.23% 4 | 0.30% |
| 1999-3 | -1.52% 3 | -0.54% 4 | -1.67% 5 | 0.31% 1 | -1.58% 2 | -4.98% |
| 2003-3 | -1.90% 3 | 1.55% 4 | 1.03% 5 | -1.29% 1 | -0.95% 2 | -1.56% |
| Avg | -0.67% | 0.22% | 0.35% | -0.13% | -0.28% | -0.51% |
| OTC summary for Presidential Year 3 1963 - 2003 | ||||||
| Averages | -0.11% | 0.04% | 0.03% | 0.16% | 0.03% | 0.16% |
| % Winners | 45% | 73% | 55% | 64% | 64% | 64% |
| MDD 3/2/1999 4.90% -- 3/4/2003 2.22% -- 2/28/1979 1.98% | ||||||
| OTC summary for all years 1963 - 2006 | ||||||
| Averages | 0.13% | -0.02% | -0.02% | 0.32% | 0.02% | 0.42% |
| % Winners | 55% | 61% | 50% | 67% | 50% | 61% |
| MDD 3/2/2001 8.27% -- 3/2/1999 4.90% -- 2/28/1997 2.87% | ||||||
| SPX Presidential Year 3 | ||||||
| Year | Mon | Tue | Wed | Thur | Fri | Totals |
| 1931-3 | 1.11% 4 | -0.77% 5 | -0.55% 6 | -2.29% 1 | -0.11% 2 | -2.61% |
| 1935-3 | -1.02% 2 | 0.34% 3 | -0.57% 4 | 0.57% 5 | 0.00% 6 | -0.67% |
| 1939-3 | 0.80% 6 | -0.08% 1 | 0.55% 2 | 0.00% 3 | -0.16% 4 | 1.12% |
| 1943-3 | 0.64% 4 | 0.00% 5 | 0.27% 6 | -0.73% 1 | -0.73% 2 | -0.54% |
| 1947-3 | -1.10% 3 | 1.18% 4 | -0.32% 5 | 0.06% 6 | -0.19% 1 | -0.37% |
| 1951-3 | -0.14% 1 | -0.78% 2 | 0.18% 3 | 0.23% 4 | 0.37% 5 | -0.13% |
| 1955-3 | -0.54% 4 | -0.14% 5 | 0.52% 1 | 0.19% 2 | 0.87% 3 | 0.90% |
| 1959-3 | -0.43% 3 | 0.18% 4 | 0.13% 5 | 0.58% 1 | 0.93% 2 | 1.39% |
| 1963-3 | 0.02% 2 | -0.70% 3 | -1.11% 4 | -0.30% 5 | 0.97% 1 | -1.12% |
| Avg | -0.44% | -0.05% | -0.12% | 0.15% | 0.59% | 0.13% |
| 1967-3 | -0.05% 5 | -1.09% 1 | 0.37% 2 | 1.04% 3 | 0.55% 4 | 0.82% |
| 1971-3 | 0.67% 3 | 0.20% 4 | -0.18% 5 | 0.26% 1 | -0.02% 2 | 0.92% |
| 1975-3 | 1.06% 3 | 0.50% 4 | 1.02% 5 | 1.76% 1 | 0.64% 2 | 4.97% |
| 1979-3 | -0.11% 1 | -1.58% 2 | 0.16% 3 | 0.64% 4 | 0.07% 5 | -0.82% |
| 1983-3 | 1.91% 4 | 0.09% 5 | -1.12% 1 | 1.90% 2 | 0.94% 3 | 3.73% |
| Avg | 0.70% | -0.38% | 0.05% | 1.12% | 0.44% | 1.93% |
| 1987-3 | 0.40% 3 | -0.37% 4 | 0.44% 5 | -0.42% 1 | 0.40% 2 | 0.44% |
| 1991-3 | -1.21% 2 | 1.36% 3 | -0.18% 4 | 0.93% 5 | -0.31% 1 | 0.58% |
| 1995-3 | 0.28% 5 | -0.88% 1 | 0.71% 2 | -0.36% 3 | -0.11% 4 | -0.36% |
| 1999-3 | -1.40% 3 | -0.67% 4 | -0.54% 5 | -0.17% 1 | -0.87% 2 | -3.64% |
| 2003-3 | -1.31% 3 | 1.17% 4 | 0.46% 5 | -0.75% 1 | -1.54% 2 | -1.97% |
| Avg | -0.65% | 0.12% | 0.18% | -0.16% | -0.48% | -0.99% |
| SPX summary for Presidential Year 3 1931 - 2003 | ||||||
| Averages | -0.02% | -0.11% | 0.01% | 0.17% | 0.09% | 0.14% |
| % Winners | 47% | 42% | 58% | 58% | 47% | 47% |
| MDD 3/3/1931 3.69% -- 3/2/1999 3.60% -- 3/4/2003 2.28% | ||||||
| SPX summary for all years 1928 - 2006 | ||||||
| Averages | 0.07% | 0.03% | 0.11% | 0.23% | 0.20% | 0.61% |
| % Winners | 55% | 56% | 58% | 65% | 57% | 67% |
| MDD 2/27/1933 6.27% -- 3/3/1931 3.69% -- 3/2/1999 3.60% | ||||||
The Alpha Fund (APHAX)
The Alpha Fund, which I manage, opened last October.
Last week YTD
APHAX 0.0% +2.5%
For information about the fund go to: http://www.thealphafunds.com/index.htm .
Conclusion
The mid and small cap indices have been leading the market up and are overbought while the large cap indices are oversold. Seasonality doesn't help much either. The pull backs in the small and mid cap indices have been modest and the large cap indices are ready for an oversold rally.
I expect the major indices to be higher on Friday March 2 than they were on Friday February 23.
Last week the large cap indices were down while the small cap indices were up so I am calling last week's negative forecast a tie.
By Mike Burke
Mike Burk is an employee and principle of Alpha Investment Management (Alpha) a registered investment advisor. Charts and figures presented herein are believed to be reliable but we cannot attest to their accuracy. The views expressed are provided for information purposes only and should not be construed in any way as investment advice. Furthermore, the opinions expressed may change without notice. To subscribe to this report : http://alphaim.net/signup.html
© 2005-2022 http://www.MarketOracle.co.uk - The Market Oracle is a FREE Daily Financial Markets Analysis & Forecasting online publication.


