


Stock Market Inflection Point Continues
Stock-Markets / Stock Markets 2012 Dec 17, 2012 - 03:40 AM GMTBy: Tony_Caldaro

 After the FED increased QE 3 from $40 bln/month to $85 bln/month on wednesday the SPX made a new uptrend high at 1439. After that the market pulled back for the rest of the week. For the week the SPX/DOW were -0.25%, and the NDX/NAZ were -0.35%. Foreign markets performed better, with Asian markets gaining 1.8%, European markets gaining 1.1%, and the DJ World index rising 0.6%. Economic reports for the week again displayed positive reports outpacing negative reports. On the uptick: business/wholesale inventories, retail sales, industrial production, capacity utilization, the monetary base, the WLEI, and weekly jobless claims improved. On the downtick: the budget/trade deficits worsened, export/import prices declined, and the CPI/PPI declined as well. Next week we get reports on Housing, PCE prices, and Q3 GDP, all during Options expiration week. Best to your holidays!
LONG TERM: bull/bear market inflection range still in play
Our preferred long term bullish count remains on track. We have been counting this bull market as a five Primary wave structure from March 2009. The first two Primary waves ended in 2011 at SPX 1371 and 1075 respectively. Primary wave III has been underway from that low. Primary I divided into five Major waves, with a subdividing Major wave 1. Primary wave III appears to be following the same path. The exception being a subdividing Major wave 3. Currently the market should be rising in an Intermediate wave iii of Major wave 3. Thus far, this uptrend has yet to display the strength normally associated with a third wave. Over the past few weeks we have been also tracking a viable alternate bearish count. This is the reason for the inflection point.
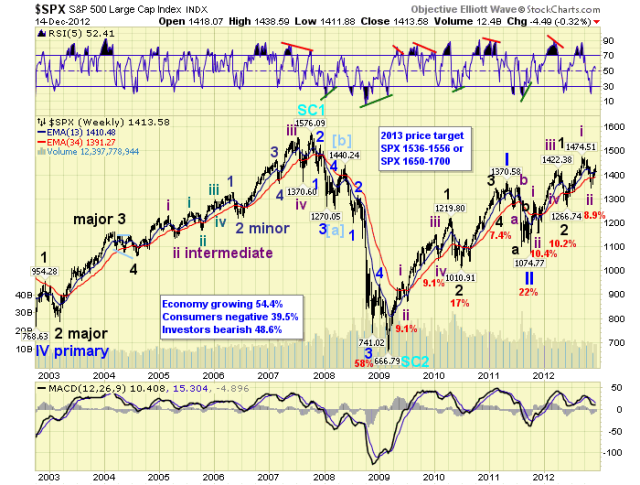
As we have noted over the past several weeks. The initial downtrend during the past five bear markets, (going back to 1981), produced a market loss between 6.9% and 13.8%. After the decline, the counter-trend uptrend that followed retraced between 69% and 90% of the previous decline. At the recent downtrend low the SPX lost 8.9%, and the DOW lost 8.7%, of its value. This suggested, even in a bear market counter-trend rally, the SPX should reach between 1434 and 1462, (DOW 13,293 and 13,543), before resuming the bear market.
This week both the SPX and DOW moved into the lower end of that range for just two trading days. Then they turned lower even after the FED increased QE 3 from $40bln/mth to $85bln/mth. In recent years these kinds of increases in quantitative easing had fueled fairly substantial rallies. QE 3, however, has produced very small positive market responses. When initially introduced on September 13th, the SPX rallied that day, made an uptrend price high the next, went sideways for a month, and then corrected the 8.9% off the price high. This week’s increase in QE 3 has produced, thus far, even less of a rally. As a result of the market’s non-response to the FED’s doubling down on quantitative easing, we are raising the probability of this alternate count to 40%. We are still bullish, but the probabilities are now only 60% – 40%.
MEDIUM TERM: uptrend
The recent downtrend bottomed in mid-November at SPX 1343. This was within a few points of our worse case support zone: SPX 1345/46. Since that low our 96% accurate WROC indicator generated a buy signal. Suggesting an uptrend confirmation was upcoming. That uptrend confirmation arrived this week.
Our 60% probability bullish count suggests this uptrend is Intermediate wave iii of Major wave 3. For the market to continue in this bullish mode, this uptrend will need to make new bull markets highs before it ends. This suggests an ongoing uptrend, lasting at least three months, and rising much above the recent SPX 1475 high. In fact, since Intermediate wave i was 208 SPX points, the minimum we would expect is around SPX 1550. This would allow for a small correction during Int. iv, which is normal for this bull market. Then new highs for Int. wave v and the conclusion of Major wave 3.
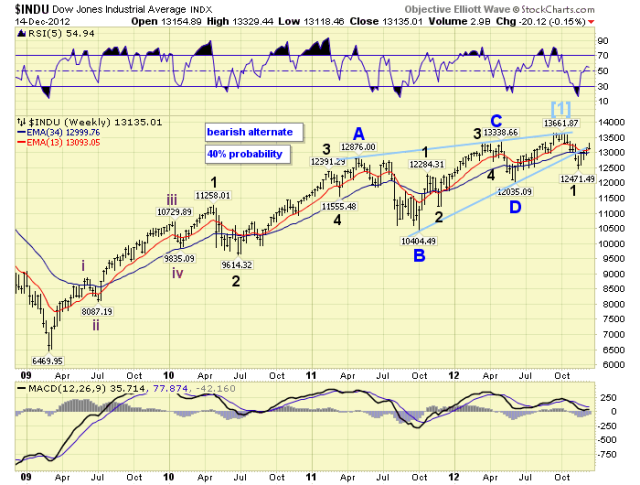
Our 40% probability bearish count suggests this uptrend is Major wave 2. Major wave 1 having completed at the recent SPX 1343 low. For the market to turn bearish this uptrend will need to end within the SPX 1434-1462 inflection range. What would likely follow, since the first downtrend was 132 SPX points, would be a drop near SPX 1267. Then after another counter-trend uptrend, a decline to near SPX 1159 would end Primary A of a new ABC bear market.
Until the SPX/DOW clear the inflection range some hedging is probably a good idea. Medium term support is at the OEW 1386 and 1372 pivots, with resistance at the 1440 and 1499 pivots.
SHORT TERM
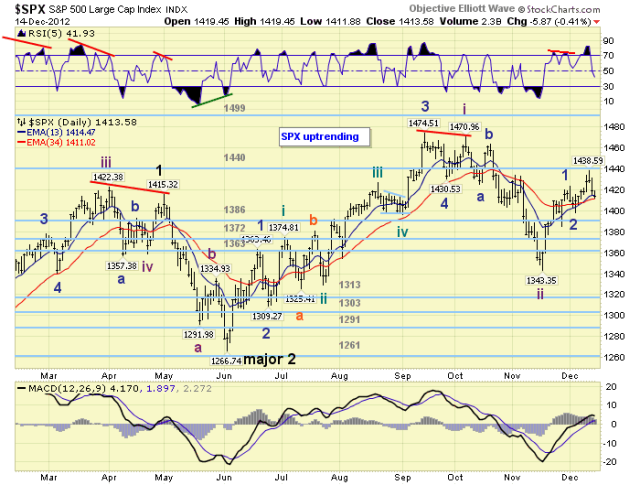
Short term support is at SPX 1413/16 and 1402/03, with resistance at 1422/27 and the 1440 pivot. Short term momentum is displaying a slight positive divergence. The short term OEW charts are now negative with the swing level around SPX 1419.
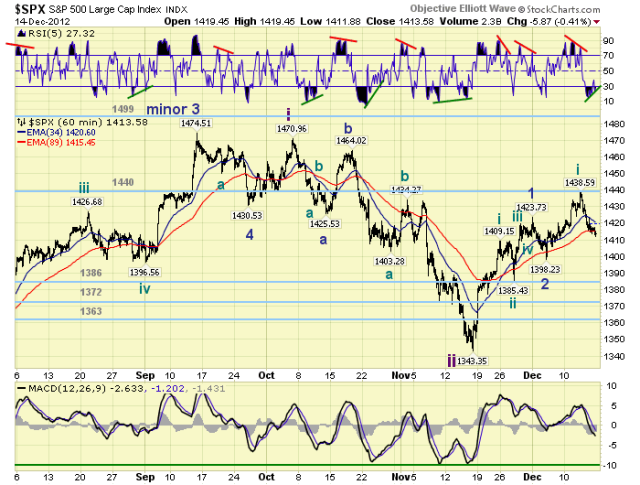
From the SPX 1343 low we have counted five waves up to SPX 1424: (1409-1385-1420-1409-1424). This rally can be either a bullish Minor wave 1 of Intermediate wave iii, or a bearish Intermediate wave A of Major wave 2. Next we had a decline to SPX 1398. The bullish count suggests it was Minor wave 2, the bearish count Intermediate wave B.
After the SPX 1398 low the market again rallied in five waves to SPX 1439: (1416-1406-1434-1424-1439). Since this was quite short in comparison to Minor wave 1, and has already overlapped it, we have labeled it Minute wave i of Minor wave 3. Minor wave 1 also had five small waves up to SPX 1409: (1361-1351-1390-1377-1409) which we had labeled Minute wave i of Minor 1. So they look similar from that perspective.
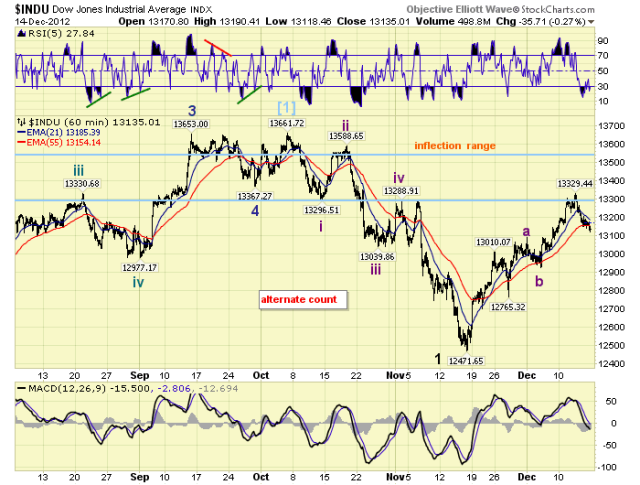
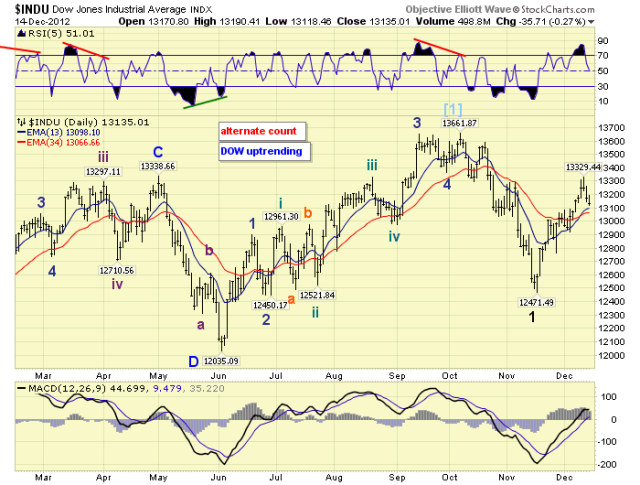
Under the bearish scenario it is not quite as clear. The five wave rally from SPX 1343-1424 was 81 SPX points. After the pullback to SPX 1398, the market has rallied another five waves to 1439, or 41 points. And, it hit within the range of a normal bear market rally. This rally now has a 50% relationship to the first rally. This is an acceptable 5-3-5 zigzag count for the potential Major wave 2. If SPX 1398 is retested, during the current pullback, and then fails to hold support the bearish case increases in probability. However, if SPX 1398 or higher, holds support then we could see a rally back into the inflection range to complete waves 3-4-5 from SPX 1398. It certainly is an important time for the markets as we head into the Holidays!
FOREIGN MARKETS
The Asian markets were mostly higher on the week gaining 1.8%. All but Indonesia are uptrending.
The European markets were also mostly higher gaining 1.1%. All indices uptrending.
The Commodity equity group were all higher on the week gaining 1.7%. All but Canada are uptrending.
The DJ World index is uptrending and gained 0.6% on the week.
COMMODITIES
Bonds sold off this week as QE 3 was increased, losing 0.9% on the week, and possibly entering another downtrend.
Crude remains in a downtrend but gained 0.9% on the week.
Gold also remains in a downtrend and lost 0.5% on the week.
The USD downtrend continues as the DXY lost 1.0%. The uptrending EURUSD gained 1.8%, and the downtrending JPYUSD lost 1.2%.
NEXT WEEK
A busy week ahead of the Holidays. Monday: the NY FED at 8:30. Tuesday: the NAHB housing index. Wednesday: Housing starts and Building permits. Thursday: Q3 GDP, (est. +2.7%), Existing home sales, the Philly FED, Leading indicators, the FHFA housing index, and weekly Jobless claims. Friday: Personal income/spending, PCE prices, Durable goods orders, Consumer sentiment, and Options expiration. As for the FED, there is one speech scheduled for monday at 11:00 from FED governor Stein on USD funding and Global banks. Best to your weekend, week and Holidays!
CHARTS: http://stockcharts.com/...
http://caldaroew.spaces.live.com
After about 40 years of investing in the markets one learns that the markets are constantly changing, not only in price, but in what drives the markets. In the 1960s, the Nifty Fifty were the leaders of the stock market. In the 1970s, stock selection using Technical Analysis was important, as the market stayed with a trading range for the entire decade. In the 1980s, the market finally broke out of it doldrums, as the DOW broke through 1100 in 1982, and launched the greatest bull market on record.
Sharing is an important aspect of a life. Over 100 people have joined our group, from all walks of life, covering twenty three countries across the globe. It's been the most fun I have ever had in the market. Sharing uncommon knowledge, with investors. In hope of aiding them in finding their financial independence.
Copyright © 2012 Tony Caldaro - All Rights Reserved Disclaimer: The above is a matter of opinion provided for general information purposes only and is not intended as investment advice. Information and analysis above are derived from sources and utilising methods believed to be reliable, but we cannot accept responsibility for any losses you may incur as a result of this analysis. Individuals should consult with their personal financial advisors.
Tony Caldaro Archive |
© 2005-2022 http://www.MarketOracle.co.uk - The Market Oracle is a FREE Daily Financial Markets Analysis & Forecasting online publication.