


Stock Market Cycle Turning Points Analysis- Insiders Remain Bullish
Stock-Markets / US Stock Markets Feb 25, 2008 - 07:17 AM GMTBy: Andre_Gratian

 Current Position of the Market
SPX: Long-term trend - Election years that fall in the 8th year of the Decennial pattern call for consolidation in the early part of the year followed by a strong finish. But the 6-yr cycle which is scheduled to bottom in late Summer/early Fall could also play a restraining role, followed by an eventual bull market top in 2009-2010.
SPX: Intermediate trend - an extended intermediate-term consolidation is in process.
Analysis of the short-term trend is done on a daily basis with the help of hourly charts. It is an important adjunct to the analysis of daily and weekly charts which determines the course of longer market trends.
Daily market analysis of the short term trend is reserved for subscribers. If you would like to sign up for a FREE 4-week trial period of daily comments, please let me know at ajg@cybertrails.com .
Overview
Since its climactic low of 1270 on 1/23, the SPX first rallied sharply, then settled into a trading range between about 1320 and 1370. After three unsuccessful attempts at breaking out above 1370, last Friday it tested the lower part of its range, but ended the day with a sharp reversal in the last half hour of trading which took it from a 15-point loss to a 10-point gain.
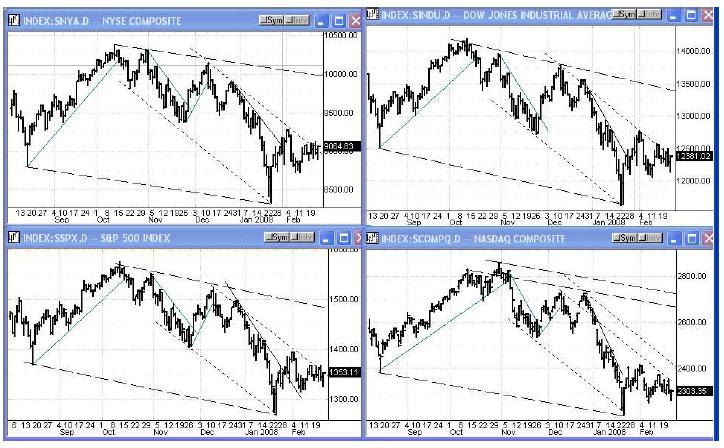
All major indices, as you can see on the chart below, are making the same basic pattern: they are in a well-defined down channel (dotted lines) which represents the intermediate correction that they are presently undergoing, and they have been trying to break out of it for the past week. At first, on Friday it seemed as if they were giving up and resuming their downtrend, but by the close, it looked more as if they had dropped a little lower to get a better running start to overcome the hurdle. This puts them at a critical juncture! They must follow through to the upside over the next few days to get out of those channels, and it they do, it will increase the chances that January was the low of the correction -- at least for a bit longer! There are still major hurdles ahead before they can get back into an uptrend.
What's ahead?
Momentum:
Since January, the momentum has been sideways. Friday's late-day rally prevented a resumption of the downtrend or test of the low, but it must follow through on Monday to finally break outside the down-channel and upper resistance, and to move beyond 1370.
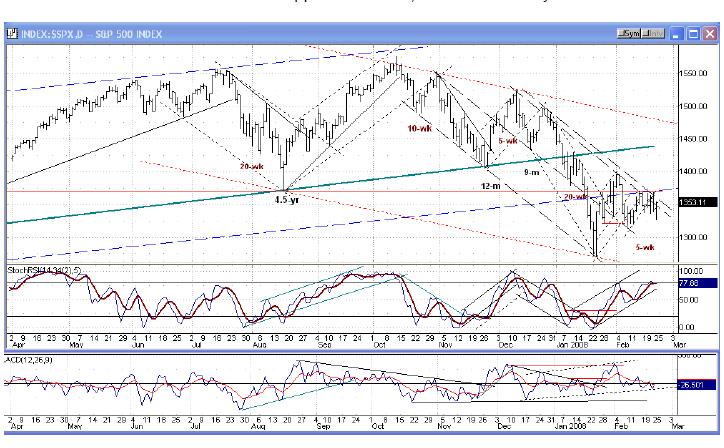
On the daily SPX chart above, both oscillators are still in an uptrend but will need a predominance of positive daily closes over the next few days if they are to maintain it. This may not be easy to achieve, especially since the momentum indicator is nearly overbought.
Cycles
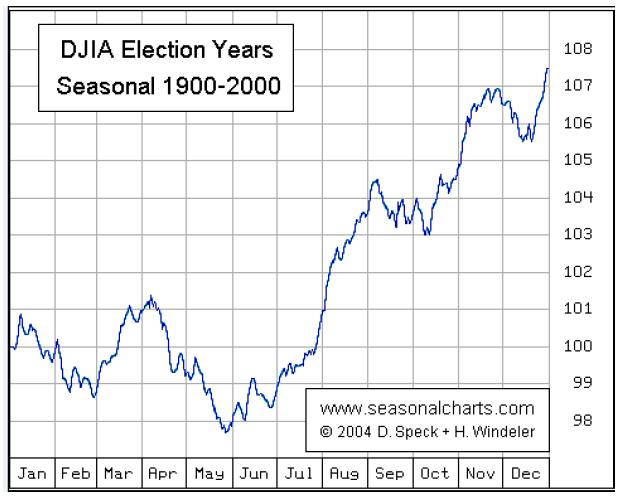
So far, the market appears to be basically conforming to the election year seasonal pattern which is represented by the following chart. Since the 9-mo cycle of the Hurst series is due to bottom in May, it would seem to reinforce that possibility. On the other hand, if January marked the low of a 94-mo cycle, May could be only a secondary reaction. Based on current technical evidence, we cannot come to any hard and fast conclusion and we will have to let the market reveal its intentions when it is ready to do so.
Short term, economic news appears to be dictating the way and producing wild swings. The next short-term cycle of consequence is the 6-wk cycle whose low is due in the week of March 10, with the 10-wk due the following week.
Projections:
On Friday, I wrote the following in an update to subscribers: ... we are approaching a low, as the A/D continues to show higher lows as the SPX makes lower lows, indicating less and less selling is taking place at each new low. We are also approaching the target zone which looks to be in the midtwenties, but could possibly have been reached at 1329. The low came shortly afterwards at 1327.
If the rally which started near the close on Friday moves past 1370, it should continue to about 1385. There is also an unfilled Point & Figure count of 1424 resulting from the base made in January.
Breadth
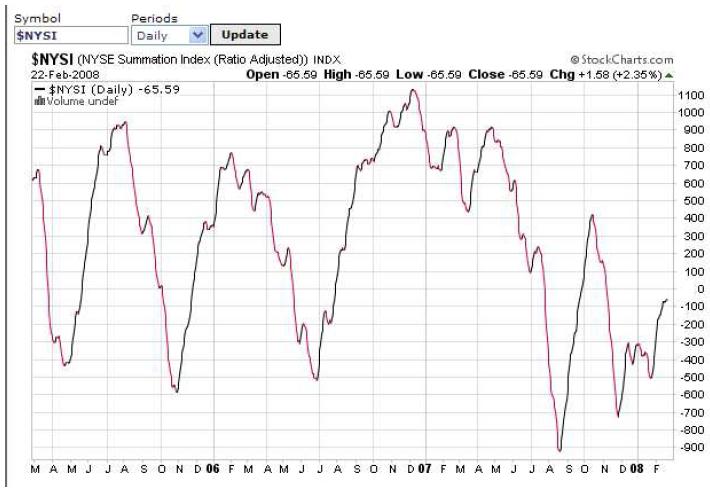
The NYSE McClellan oscillator has corrected from overbought to the zero line. It now needs to turn up once again if the Summation index (below, courtesy of StockCharts) is to continue its bullish uptrend.
Market Leaders and Sentiment
GE and NDX are either in synch with the SPX or slightly lagging. The Banking Index could be working on the right shoulder of an inverse head and shoulder pattern which would be bullish if completed successfully.
Sentiment indicators range from neutral to bullish. Insiders remain bullish.
Summary
Since its low of January and an initial sharp rally, the SPX has been trading in a narrow range which could either turn out to be a base pattern which may have to be expanded, or a pause on the way to a final low in May in conjunction with the 9-mo cycle bottom.
A market advisory service should be evaluated on the basis of its forecasting accuracy. This is probably the best all-around value. Two areas of analysis that are unmatched anywhere else - - cycles and coordinated Point & Figure and Fibonacci projections -- are combined with other methodologies to bring you weekly reports and frequent daily updates.
The following are examples of unsolicited subscriber comments:
What is most impressive about your service is that you provide constant communication with your subscribers. I would highly recommend your service to traders. D.A.
Andre, You did it again! Like reading the book before watching the movie! B.F.
I would like to thank you so much for all your updates / newsletters. as i am mostly a short-term trader, your work has been so helpful to me as i know exactly when to get in and out of positions. i am so glad i decided to subscribe to turning points. that was one of the best things i did ! please rest assured i shall continue being with turning points for a long while to come. thanks once again ! D.P.
But don't take their word for it! Find out for yourself with a FREE 4-week trial. Send an email to ajg@cybertrails.com .
By Andre Gratian
MarketTurningPoints.com
A market advisory service should be evaluated on the basis of its forecasting accuracy and cost. At $25.00 per month, this service is probably the best all-around value. Two areas of analysis that are unmatched anywhere else -- cycles (from 2.5-wk to 18-years and longer) and accurate, coordinated Point & Figure and Fibonacci projections -- are combined with other methodologies to bring you weekly reports and frequent daily updates.
“By the Law of Periodical Repetition, everything which has happened once must happen again, and again, and again -- and not capriciously, but at regular periods, and each thing in its own period, not another’s, and each obeying its own law … The same Nature which delights in periodical repetition in the sky is the Nature which orders the affairs of the earth. Let us not underrate the value of that hint.” -- Mark Twain
You may also want to visit the Market Turning Points website to familiarize yourself with my philosophy and strategy.www.marketurningpoints.com
Disclaimer - The above comments about the financial markets are based purely on what I consider to be sound technical analysis principles uncompromised by fundamental considerations. They represent my own opinion and are not meant to be construed as trading or investment advice, but are offered as an analytical point of view which might be of interest to those who follow stock market cycles and technical analysis.
Andre Gratian Archive |
© 2005-2022 http://www.MarketOracle.co.uk - The Market Oracle is a FREE Daily Financial Markets Analysis & Forecasting online publication.