


Stock Market Elliott Wave Analysis of Blow off Tops, Apple Stock Example
Stock-Markets / Stock Markets 2012 Dec 10, 2012 - 03:49 AM GMT

 SPX Long Term
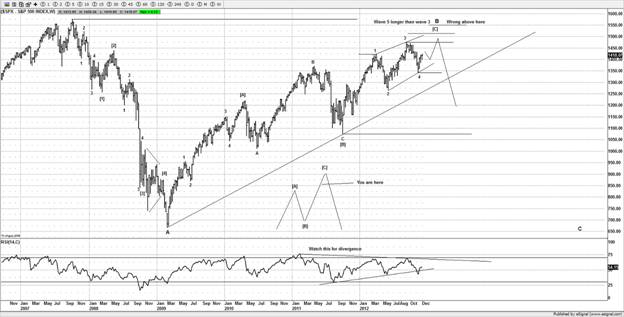
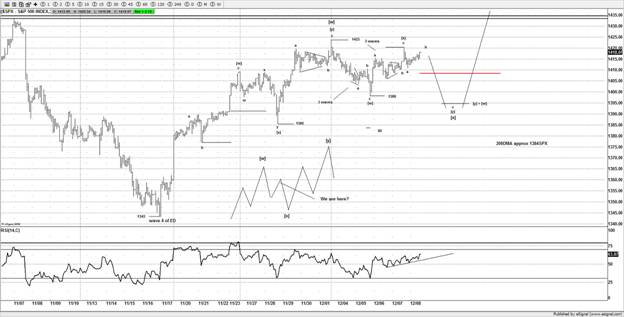
My preferred wave count is similar to the idea I posted some weeks back on the DAX and that I suspect the SPX is inside a 5th wave for an ending diagonal so likely to chop higher into Jan-Feb period next year before a meaningful high. It would need a seriously strong break below the 200DMA on the SPX before I would switch to an alternative bearish idea, whilst this market continues higher I still prefer the bullish option over the bearish option.
Although I am certainly no perma bull and calling for SPX 2000 or anything like that, recent price action over the last few days suggests the market is simply correcting the advance from the Nov 2012 lows and likely to push higher once the correction has finished.
When you look at other US markets we can clearly see the same sort of shape, especially markets such as the NYSE. The last decline from the September 2012 highs was a 3 wave decline as we can clearly see the NYSE is pushing higher as I suspect it would, but is lacking the new high it needs to complete its idea.
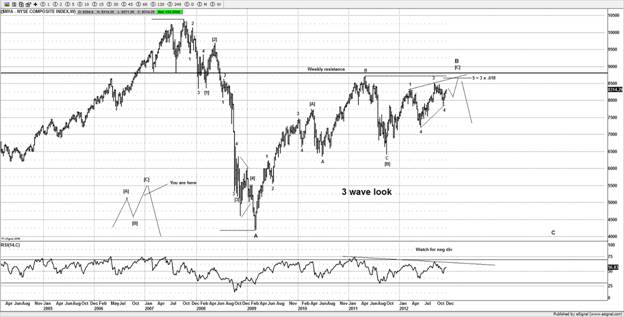
So whilst both patterns suggest more upside I remain bullish on this market and looking for those new highs, it would need to impress me with some serious aggressive downside price action before I am convinced this market is bearish.
Although I do have an alternative bearish idea that I am watching, with the seasonal bias upon us now the markets tends to float higher due to the low liquidity levels and I suspect this will help the US markets reach their respective targets. I am not ready just yet to give up on this market making new highs.
I am not convinced by the bearish case, that the bears are presently using has any merits, simply because I see other markets that are presenting better alternatives which are more representative of the current price action.
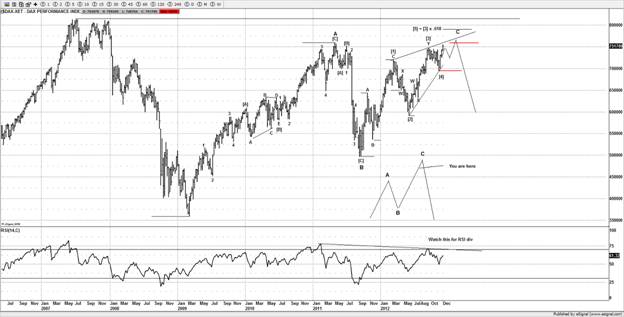
Most of the European markets have exceeded their respective September 2012 highs, which technically completes the DAX idea I present to readers a few weeks back. But with the US markets lacking that new high I am going to stay with the trend and give the benefit to the bulls to push the SPX towards 1480-1500.
SPX
Having hit our target range between 1420-30SPX on Monday we went into this week looking for a high and a pullback towards 1390SPX before the resumption of the trend should push the SPX higher.
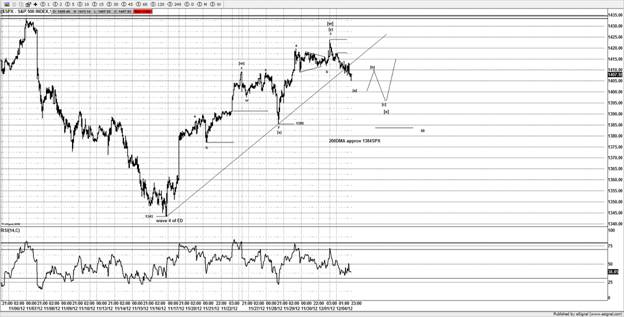
Well Monday gapped up into resistance and set the scene for a decent pullback which we could sell.
It turned out to be a decent decline as it almost tagged its 1st target at 1400SPX the low came in around 1403SPX. So the idea of a 2-3 day pullback appeared to be working well.
However like all corrections they have a habit of choppy traders around and creating some issues.
By Wednesday the market staged a decent push higher which I was pretty confident it was a trap for the bulls and we had a date with lower prices again as the decline felt too shallow for what I was expecting, a decent mini wash out to create some bearish sentiment was needed.
What followed was another 2 days of chop and whipsaw as the market was really taking traders to the wood shed with the swings.
It still appears to be chopping around in 3 wave swings which are nasty to trade as they create traps for both bulls and bears. By Fridays close I was glad to see the markets actually close, so I could digest the price action.
If you noticed on Friday the DOW was pushing higher but the NDX could not get off the floor due to AAPL bleeding, but I was impressed that the SPX and DOW held their ground, but as of Friday close I actually feel there is still a move lower left for the markets before moving higher.
Whilst I remain bullish the US markets, I always want to try and gain the optimum price entries so I can maximize gains and whilst I don’t think the market is on the verge of some sort of crash (never say never).
I was really looking for a better entry for me and members to get long and I had the 1380-1390SPX area penciled in before this move started from 1423SPX, and I still feel that is potentially the better target to get long from, although if the market gaps up on Monday and runs away then we will be forced to chase higher, but that’s never a good thing as buying a breakouts always runs the risk of a failed move.
So early next week I still like the idea of a move lower to get long but with the FOMC, we might have to wait for the market to digest any announcement first; who knows maybe the spike lower will come from the FED announcement and a knee jerk reaction?
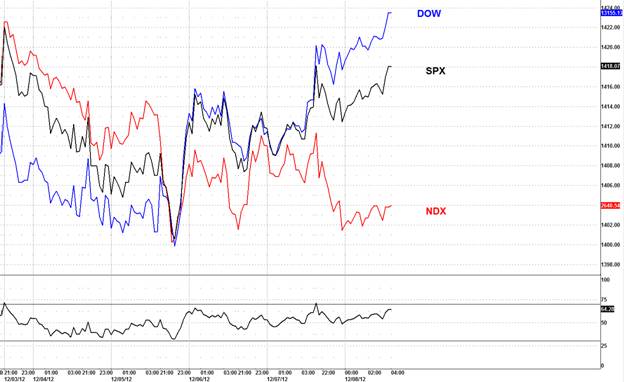
A fractured market is never a good thing and it was AAPL that was hindering the NDX, although GOOG never help much either.
The lack of continuity between the markets raises a big caution for me and I suspect Fridays move on the DOW not being registered by the NDX or SPX it is a potential trap, hence I still like the idea of some more weakness early next week although how it sets up before the FOMC will be a guess for now.
But the decline on AAPL, I suspect has a bit lower 1st before it sees a minor short term low.
AAPL
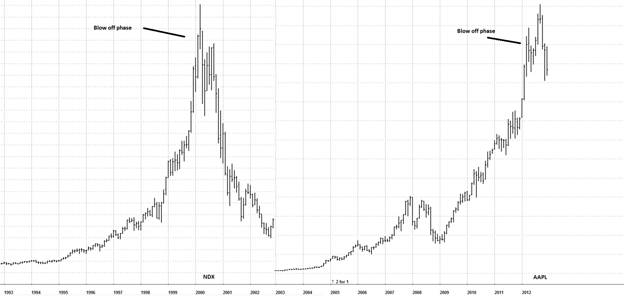
Taking about AAPL, it seems many never read the script of a blow off and what happens when the bubble bursts.
Like all blow offs they go through the same cycle and denial is always seen at the top of a trend.
Although I will be the first to admit this one pushed far higher than I thought, I figured around $600 would cap it, but then when we were seeing worthless stocks going for $1000 in the dotcom era what do you expect?
I don’t know anything about AAPL finances and frankly I don’t care, all I know is whenever I see a move just as you saw on AAPL it always ends in tears.
NDX in Red
AAPL in Black
When that day arrives who knows, but when I see complete disrespect for the markets and too many traders complacent, I know that day is going to arrive when there is going to be crying in the streets.
I even wrote this on my twitter stream on 23rd September.
“I have no words when it crashes (and it will) there is going to be pain in da streets”.
Much to the chagrin of my followers and the emails I received, they made it very clear what they thinking, and firmly on board the bull bus, exactly what I like to see when I look for a major high, everyone on the same side of the boat, and no one thinks it can reverse.
Those are the perfect conditions for a major top.
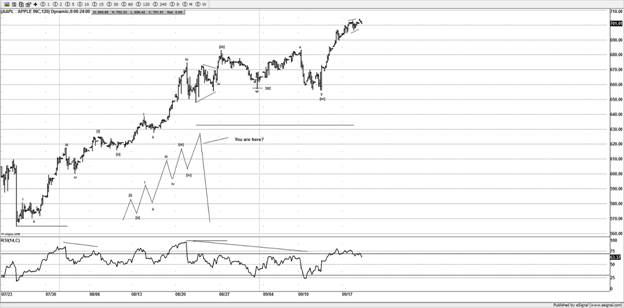
However I was watching a wave count setting up just before the highs. That call was made at $701, the stocks sits at $532.
I received an email shortly after this stock reversed from a member thanking me for recommending him to get out of AAPL. That one email made all the effort worthwhile, I am only sorry I couldn’t have helped many more AAPL holders that have held on from the $600-700 area.
I have seen too many of these parabolic moves to know that when the music stops they come crashing back to earth. You saw it last year in the Silver and Gold moves, and the Oil move in 2008.
But as usual no one sees the reversal until its too late, and sheesh have AAPL holders got a rude awaking.
Pain in da street for sure.
I don’t like to see anyone lose $$$, certainly not from poor advice to stay in stocks that have gone on a parabolic trajectory and a little bit of history could have saved many people a lot of $$.
I have read all sort of horror stories on the internet about investors loading up huge amounts of their portfolios at the $650-700 area looking for the $800-1000 area.
Remember the calls that were coming out virtually every day , AAPL was going to go to $850, $1100, $1300 etc, it seemed every wall street bank was trying to outdo each other with a higher target.
It really saddens me when people for fall the same scheme over and over again.
I want to leave you with a chart that I think you need to think about.
CMG (chipotle)
Another silly parabolic move that again ended in tears and it’s still ongoing, almost cut in half.
If you think AAPL can’t do that you better think again, there are literally 100s if not 1000s of AAPL holders all praying at this moment for a bounce. If the bounce does not come I expect a seriously strong decline and we start to see mass selling.
There are many holders of AAPL that have massive profits and have already lost large amounts so those will be looking to sell, there are many holders that are caught long above $600 buying into the fantasy dream from the media and wall street scammers.
Just ask Chipotle holders how they are getting on with being caught at the top or near the top of a parabolic blow off, it’s down 45% from the highs.
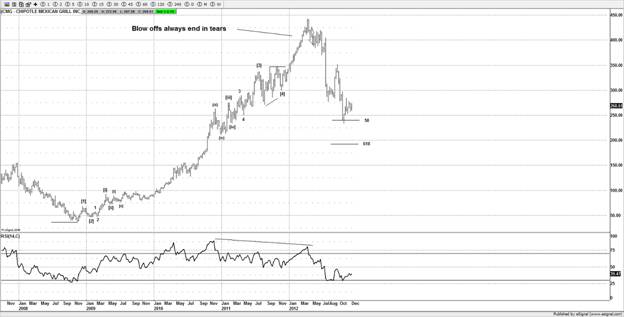
CMG had a clean 5 wave advance and reversed, that’s what happens after the trend has finished. Let’s do a comparison with AAPL with CMG.
Virtually the same sort of trajectory, I suspect the same sort of result, you will notice that I don’t even consider the “funnymentals “of the stock.
Why would I?
After all if more people sell than buy the stock goes down, why do I even need to consider how much profits they make.
Just ask AAPL holders how much profits AAPL are making, I read they made obscene amounts of profits, so why is it going down?
Why? Because it’s a simple case of more sellers than buyers, and fear has taken over, you can forget all those fancy reports about how AAPL is going to make XXX profits, it doesn’t matter; the only thing matters is price.
Elliott Wave works if it’s used in the right hands.
Have a profitable week ahead.
Click here to become a member
You can also follow us on twitter
What do we offer?
Short and long term analysis on US and European markets, various major FX pairs, commodities from Gold and silver to markets like natural gas.
Daily analysis on where I think the market is going with key support and resistance areas, we move and adjust as the market adjusts.
A chat room where members can discuss ideas with me or other members.
Members get to know who is moving the markets in the S&P pits*
*I have permission to post comments from the audio I hear from the S&P pits.
If you looking for quality analysis from someone that actually looks at multiple charts and works hard at providing members information to stay on the right side of the trends and making $$$, why not give the site a trial.
If any of the readers want to see this article in a PDF format.
Please send an e-mail to Enquires@wavepatterntraders.com
Please put in the header PDF, or make it known that you want to be added to the mailing list for any future articles.
Or if you have any questions about becoming a member, please use the email address above.
If you like what you see, or want to see more of my work, then please sign up for the 4 week trial.
This article is just a small portion of the markets I follow.
I cover many markets, from FX to US equities, right the way through to commodities.
If I have the data I am more than willing to offer requests to members.
Currently new members can sign up for a 4 week free trial to test drive the site, and see if my work can help in your trading and if it meets your requirements.
If you don't like what you see, then drop me an email within the 1st 4 weeks from when you join, and ask for a no questions refund.
You simply have nothing to lose.
By Jason Soni AKA Nouf
© 2012 Copyright Jason Soni AKA Nouf - All Rights Reserved
Disclaimer: The above is a matter of opinion provided for general information purposes only and is not intended as investment advice. Information and analysis above are derived from sources and utilising methods believed to be reliable, but we cannot accept responsibility for any losses you may incur as a result of this analysis. Individuals should consult with their personal financial advisors.
WavePatternTraders Archive |
© 2005-2022 http://www.MarketOracle.co.uk - The Market Oracle is a FREE Daily Financial Markets Analysis & Forecasting online publication.