


Trading - Timing The Entry into a Market Position
InvestorEducation / Forecasts & Technical Analysis Feb 21, 2007 - 10:27 AM GMTBy: Hans_Wagner
 Timing the Entry sets the parameters to buy the potential high profit stocks that have been identified. The objective is to identify the rules that will be used to enter a buy (or short), the exit target and the trailing stop. Technical analysis provides the best way to effectively plan the trade. Many people believe that being able to properly read and interpret a chart leads to profitable trades. Unfortunately, this is not true. Reading a chart to identify the existing patters, trends and interpreting the indicators only provides the framework for executing a trade. The secret is to identify the characteristics on the chart that when realized will yield an optimal trade opportunity. You are preparing to commitment your hard earned money, so you want to be as sure as possible that the trade criteria is the best it can be.
Thomas N. Bulkowski, a hardware and software design engineer with Raytheon and Tandy, conducted a statistical study of stock chart patterns from 1991 to 1996. His study, Encyclopedia of Chart Patterns (Wiley Trading) , statistically analyzes the performance of over 50 chart patterns identifying best performing bullish and bearish patterns. These patterns along with changes in daily volume help indicate entry, target and exit points for trading stocks. Technical Analysis of the Financial Markets: A Comprehensive Guide to Trading Methods and Applications (New York Institute of Finance) by John Murphy and Technical Analysis from A to Z, 2nd Edition
by Steven B. Achelis are good sources on technical analysis.
Before entering a trade it is important to have a clear plan of where I want to enter the trade, where I will have my initial stop loss, and where I expect to exit the position. There are many ways to use technical analysis, however, most professionals use one these two basic ways to time their trades. First, enter the trade on a breakout through resistance that is accompanied by strong, above average volume. If the market trend is down then this would be a breakdown through support. It might or might not be accompanied by high volume, as prices can fall without volume to support them. Second, is to wait for a pullback and then enter near the identified support or resistance area.
Generally, I look for support levels to help identify a good entry price. I like to pick a price range, as these levels are not that specific. During good times when the market is trending up and the economy is in Early Recovery or Full Recovery stage, the price may not fall to a clear support level. Rather it might approach a support level during a brief pull back before resuming its up trend. In this case, I will enter an order when it looks like the pull back is over and the price is starting its move up.
On the other hand, when the market is trending flat or down and the economy is in Early Recession or Full Recession stage, I will wait till the support level is hit and holds before finalizing the entry price. I want to see the market beginning at least a short term up trend. During these times patience is key. Trading just to trade will usually lead to losses.
For the record I will rarely go short against the market or the economy. When the market is in an overall up trend and it enters a short term pull back due to overbought conditions, I use this as an opportunity to sell shares of underperformers and buy more promising companies. However, if the market is trending flat or down and the economy is entering or near Early Recession or in Full Recession, I will definitely go short. My favorite way to short the market is with funds that try to match 200% of the inverse performance of a key index such as the DJIA, S&P 500, the NASDAQ 100 and the Russell 2000. I also like some of the Exchange Traded Funds that are index or sector related for the same purpose. These are liquid investments that are easy to trade.
Which is the best method to use? Well like so many things, it depends on what the chart formation and indicators offer you. In addition, you need to consider the overall market trend; is it just beginning another up leg or is it near a potential top. Where are the best stop and target exits, how long to hold the position, and, most important, what is the risk reward for the potential trade?
Let's examine some sample trading plans to get an idea how to plan the trade. Keep in mind that there might be more than one entry strategy that presents it self. That is just fine and can be quite useful as the trade is planned.
The Buy
T. J., our industrious investor, has read and studied Thomas N. Bulkowski's book , Encyclopedia of Chart Patterns (Wiley Trading). Late November 2004, he believed that CRZO met his stock selection criteria based on the fundamentals. He then complied the chart for Carrizo Oil & Gas, Inc. (CRZO) you see below. T.J. had observed that the overall market was in a secular bull market and that the price of oil was trending up.
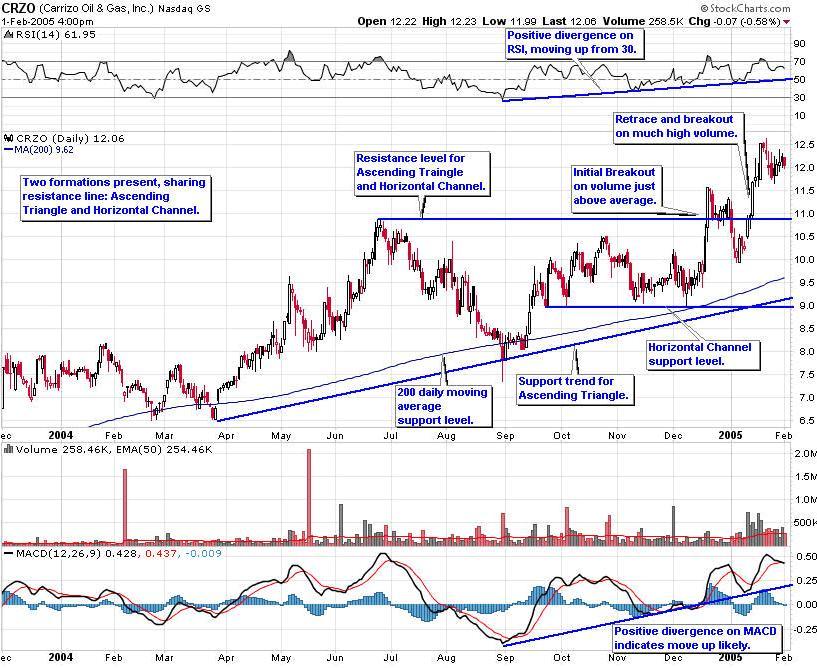
He noted that there was resistance (the high reached the week of 6/21/04) at 10.87, then in October the price hit a high of 10.50, and there was an underlying up trend that began April 2003 with average volume increasing. He knew that this pattern is called an ascending triangle. Ascending triangles represent market supply and demand forces of a stock that is building support through the uptrend and encountering resistance at the horizontal line. Looking at CRZO T.J. noted that retreats toward the lower uptrend encountered buyers who think this is a good buy causing the price to go up. As it approaches the resistance line sellers who have been in the stock from earlier positions close out some of their positions causing the stock to stop rising.
T.J. knows that a break out (the stock moves above 10.87 with strength) will only occur if there is sufficient buying volume to move the stock up. So he created an alert in his stock trading system that would warn him when this stock price reached 10.50 (.37 below break out). T.J. also entered an alert for CRZO on the down side after noting that in addition to the uptrend, the 200 daily Moving Average seemed to act as support as well. He chose 9.8 as that alert price. The 200 period Moving Average is also an important indicator or the trend for the period being evaluated. If the MA is pointing up then the trend is up. Conversely, if the 200 MA is pointing down then the trend is down. More importantly, if the 200 MA is transitioning from down to up, then we have a trend change which is positive for going long. And if the 200 MA is changing from up to down, going long is not likely to be the best position to take.
In November and then again in early December the price approached near 9.0, near prior support levels and just above the 200 daily moving average. This created a horizontal channel, another formation that further helped T. J. believe CRZO had good appreciation potential. The positive divergence in the RSI and MACD indicators also implied that the price will rise further. This created another potential entry near the support level of 9.0. The Moving Average Convergence/Divergence (MACD) often can foretell a change in direction of the stock price by examining it for negative or positive divergences that might indicate the price is going to make an important move.
As a result T.J. documented his entry levels on his watch list. His plan was to buy near the 9 - 9.5 support level and on any break of 10.87 with volume. For the entry neat support, a stop loss could be placed below the support level of 9, at 8.75, to help minimize any loss. For the break of 10.87, his plan is to buy just above this level when volume was strong (at or above 130% projected for the day). He decided set the stop for this buy just below the the recent interim high of 10.5 selecting 10.43. Both of these stops will protect him from incurring greater losses than he was willing to risk.
Capital to Risk
Next, T.J. determines the amount of capital to put at risk in the trade. I use "put at risk" in place of invest, since that is what he is doing - risking his precious capital. In making this decision T.J. considers how this stock will help him diversify his investments, the stage in the business cycle and the size of his portfolio.
In financial investment theory there are two types of risk, Unsystematic and Systematic. Unsystematic Risk is specific to a company. Should a company experience, a strike, a natural disaster, or sudden slumping sales, then the stock will be affected accordingly. This type of risk can be partially addressed by have a diverse portfolio of stocks in different industries, since events that affect one company will not likely affect another. I like to call this company risk, as it makes more sense to me than unsystematic risk.
On the other hand, some events can affect all companies at the same time. Inflation, war, and rising interest rates negatively influence the general economy, not just a specific company or industry. This type of risk is called Systematic Risk and diversification cannot eliminate this risk from your portfolio. To me a better term is market risk.
Proper diversification will help an investor to reduce the impact of company risk by spreading out your capital among different sectors. If one company or sector experiences a problem, then your loss is limited to just the fall in the stock of that one company. Hopefully, the other sectors are able to make up for that loss. Selecting sectors and stocks in those sectors that should experience positive returns offer an excellent way to take advantage of the stages in the business cycle.
However, diversification can reduce the return of your portfolio. By selecting several assets, the overall return on your portfolio will be the weighted average of the returns of those assets. For example, a portfolio made up two stocks, each with the same beginning invested capital. In one year, stock A has a total return of 30 percent, the stock B a total return of 6 percent. The portfolio return will be only 18 percent (36 divided by 2). However, if the entire portfolio were invested in stock A, the return would have been 30 percent. The reverse is also true. If the entire portfolio had been made up of Stock B then the total return would be 6%. The result is diversification tends to moderate portfolio performance.
The stage of The Business Cycle helps me decide whether I will invest fully, invest in stages or take a smaller position. If the economy is in Full Recession or Early Recession, I will take a small position as the market risk is high. During the Early Recovery stage, I will take a full position to take advantage of the market trend. Early in the Full Recovery stage I will also take a full position, again to take advantage of the market trend. Late in the Full Recovery stage I will take a partial position, with the intention to add to my position if the trend of the stock continues.
The size of the portfolio is another determinate to decide how much to invest in any one stock. The following is a guideline and should not be taken literally. Each situation should reflect the economic environment and your individual appetite for risk. If one is working with a small portfolio, then 5 stocks is probably sufficient to establish a worthwhile position and remain diversified. That is why the Initial Portfolio with its $10,000 starting capital has no more than 5 stocks. However, the Premium Portfolio with its $100,000 starting capital may have 10 stocks in it when fully invested. A $1 million portfolio might have 15 stocks in it when fully invested.
Generally, I will have no more than 15 stocks in my portfolio. More than that and I do not have sufficient time to monitor them, assuming one spends 1 hour per week per stock in your portfolio. I then spend the remainder of my time researching the economy, the overall market and looking for other opportunities. Often I will have fewer stocks in my portfolio, especially when the economy is weakening or in recession.
After all this, the guidelines to make the decision on the amount to invest are actually straight forward. For small portfolios consider investing up to 20% of your total portfolio capital in any one stock during good economic times (Early Recovery and Full Recovery). For a fully invested $10,000 portfolio you would own 5 stocks with an initial value of $2,000 each. When the economy is in Early Recession or Full Recession then only invest half that, as you do not want to risk your capital during economic slowdowns. It is OK to be in cash during these times. Also when shorting I typically use a couple of funds and ETFs that seek to match 200% of the inverse of a specific index. The value of the fund's shares will tend to increase on a daily basis by 200% of the value of any decrease in the index. If the underlying index goes down 5%, the value of the Fund goes up by approximately 10%. This creates additional leverage, so I do not feel the need to fully invest my capital during down markets.
For medium sized portfolios consider investing up to 10% of your total portfolio capital in any one stock during good economic times (Early Recovery and Full Recovery). For a fully invested $100,000 portfolio you would own 10 stocks with an initial value of $10,000 each. Keep in mind this can and does vary depending on the business cycle and companies under consideration. When the economy is in Early Recession or Full Recession only invest half that, seeking to preserve your capital. It is OK to be in cash during these times. Also when shorting I typically use a couple of funds and ETFs that seek to match 200% of the inverse of a specific index. The value of the fund's shares will tend to increase on a daily basis by 200% of the value of any decrease in the index. If the underlying index goes down 5%, the value of the Fund goes up by approximately 10%. This creates additional leverage, so I do not feel the need to fully invest my capital during down markets.
For large portfolios consider investing 6-7% of your available total portfolio capital in any one stock during good economic times (Early Recovery and Full Recovery). For a fully invested $1,000,000 portfolio you would own 15 stocks with an initial value of $67,000 each, approximately. Keep in mind this can and does vary depending on the business cycle and companies under consideration. When the economy is in Early Recession or Full Recession only invest half that, seeking to preserve your capital. It is OK to be in cash during these times. Also when shorting I typically use a couple of funds and ETFs that seek to match 200% of the inverse of a specific index. The value of the fund's shares will tend to increase on a daily basis by 200% of the value of any decrease in the index. If the underlying index goes down 5%, the value of the Fund goes up by approximately 10%. This creates additional leverage, so I do not feel the need to fully invest my capital during down markets.
Please keep in mind that these are guidelines and not specific rules to be followed. Good investors make informed decisions, recognizing when to follow the guidelines and when to modify them. Also, these guidelines are for stock portfolios. There are other investment vehicles like options, bonds, leaps, etc. that offer more sophisticated ways to manage portfolios. For now we are just considering stock portfolios.
T.J., as a Premium Member of Trading Online Markets knew all this and decided to initially invest 5% of his portfolio if he can get a buy neat support. He would add another 5% on a break of 10.87 with volume.
Holding Period
Next T. J. identifies holding period for his investment. There are three reasons to set a holding period for each trade. First, you need to set a time limit on how long will you will gold the stock, if the price does not make its expected move. Second, if you expect to hold for approximately 1 year, then you need to consider the tax consequences of holding given your own tax situation and the tax benefits of long term capital gains. Third, since the announcement of a company's earnings can "surprise" the market, either up or down, you need to decide are you willing to hold through the next earnings release given the fundamentals of the company and the stage of the business cycle.
Ideally, your expectation for a stock's price movement takes place and you achieve our exit point. Or in the worse case the price hits your stop and you exit with a minimal loss. But what happens when the price does not move up enough to hit your exit price nor does it retreat to hit the stop. Eventually you must decide to either continue holding or to exit your position. The best way is to set a time limit on how long you will hold your position.
How long you want to hold your position is dictated by the market trend, the stock's trend, how much capital you are willing to risk, and the stage in the business cycle. While this might be a lot to consider, remember you know the market trend and the stock's trend from your earlier market trend analysis and technical analysis of the stock gave us the stock's trend. Extrapolating the trend gives you a time frame for the trade. If the stock clearly fails to move with the trend then this might be a good indication it is time to move on. Also, the stage of the business cycle can help you to decide how long to hold a stock.
If you are entering or in Early Recession or Full Recession then it is prudent risk management to keep a short term holding period, such as several weeks. However, if the economy is entering or in Early Recovery and Full recovery then the length of holding period for the stock to start moving might be a little longer. However, if you believe that your invested capital could be better used on another more promising opportunity, then it is prudent to exit the position to create the capital to make the new investment.
When a company releases their quarterly earnings, the market has expectations regarding the expected revenue, earnings and other key financial and operational data. As discussed in Earnings Season , if the market believes the company has not met these expectations, it can quickly punish the price of the stock. Also, if the market believes the company's earnings exceed expectations, then the price of the stock can rise dramatically. This surprise affect, especially to the down side is what can cause significant problems for investors. To address this issue follow a simple strategy:
Do not to hold through their earnings announcements, unless there is a good reason to hold. Given that general guideline, definitely do not hold a position in a stock during the Full Recession and the Early Recession stages. There tends to be to many negative surprises when the economy is slowing down. During the Early and Full Recovery stages, is the only time that holding through earnings might make sense. If you feel a good case can be made that the announcement will positively impact the stock. In each case reassess your decision a couple of days before earnings are to be released.
T.J. noted that the economy was still in Full Recovery mode, oil was in a up trend and CRZO had a good support at the lower trend line and at the 200 daily moving average. As a result he decided to hold CRZO for a year as long as the previous criteria remain in place. He noted this on his watch list.
Risk Reward Ratio
The Risk-Reward Ratio is a simple assessment of the potential profit the trade has vs. the risk you are taking with your capital. The formula to calculate the Risk-Reward is for long positions (Exit price-Entry Price)/(Entry Price- Stop loss price); for short positions it is (Entry price-Exit Price)/(Stop Loss Price - Entry Price). One of the problems with this measure is it can give an investor a false sense of confidence. If you pick a high enough Exit Price, you can always make the trade look like it has a good risk-reward ratio. The key is to be disciplined in developing your exit price and then be conservative in developing this estimate. Once you have confirmed your exit price, look for trades that have at least 2:1 or more risk reward ratio. If the ratio is greater than 5:1 then you might want to re-examine the exit price, to be sure it is real.
Document the Trade Plan
The final step to Planning the Trade is to perform a final risk assessment and document the trade strategy. Before making a trade I perform my final risk assessment, reviewing the analysis one more time.
Writing down your strategy helps to finalize all the analysis. Later when you are reviewing and updating your trade it helps to know why you entered the trade in the first place. Documenting your trade strategy also provides the basis for analysis of your trade when it is complete.
Next I will describe how to Manage your Trade where you can see the results of this entry strategy.
By Hans Wagner
tradingonlinemarkets.com
My Name is Hans Wagner and as a long time investor, I was fortunate to retire at 55. I believe you can employ simple investment principles to find and evaluate companies before committing one's hard earned money. Recently, after my children and their friends graduated from college, I found my self helping them to learn about the stock market and investing in stocks. As a result I created a website that provides a growing set of information on many investing topics along with sample portfolios that consistently beat the market at http://www.tradingonlinemarkets.com/
© 2005-2022 http://www.MarketOracle.co.uk - The Market Oracle is a FREE Daily Financial Markets Analysis & Forecasting online publication.