DOW Stock Market Index 2007 Retest Failure – Game Over USA
Stock-Markets / Stock Markets 2012 Oct 14, 2012 - 11:42 AM GMTBy: Marc_Horn
 The DJIA has confirmed the failure of it 2007 top, confirming that we are indeed in the third wave down after completing Q-2.
In March I projected the ideal Q-2 reaching 13750 by November in Dow Stock Market Index Ready to Form a Major Top
I have spent a lot of time on methods to help confirm pivots quicker and have overcome this issue and now am testing time warping fractal waves. Because I am a simpleton it is a rule based single A4 page! I will shortly be publishing something on that so click follow on my blog to get it hot off the press.
As a result of my work it became apparent that waves behaved differently depending on where in the bigger fractal wave scale they fall in, and this methodology is applied here for you to understand its simplicity and as a result it is clear that 2007 was the peak of the 300 ish year cycle so you EW followers you can start again.
Context first:
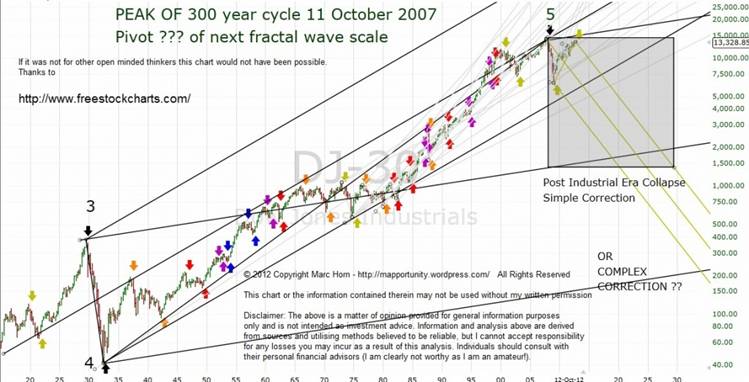
I have requested permission to use a rebuilt chart from 1790 to present and if I am given permission shall put it here! That is to show you the most complete industrial era picture I have come across. Until then the basis of this detail from 1920 is as follows;
Start of Industrial Era - Circa 1727, Pivot 1 1836, Pivot 2 1843
Until then you will have to make up your own mind!
Zooming into Dow from 1920
Zooming in a bit from 1998
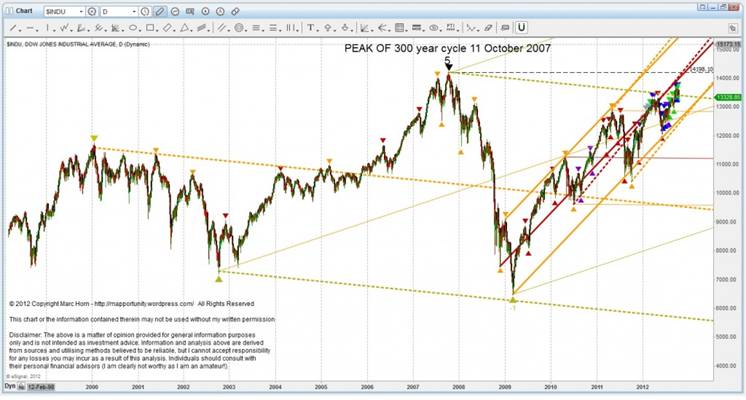
So let us just have a look at the final wave of the industrial Era that started some 300 years ago!
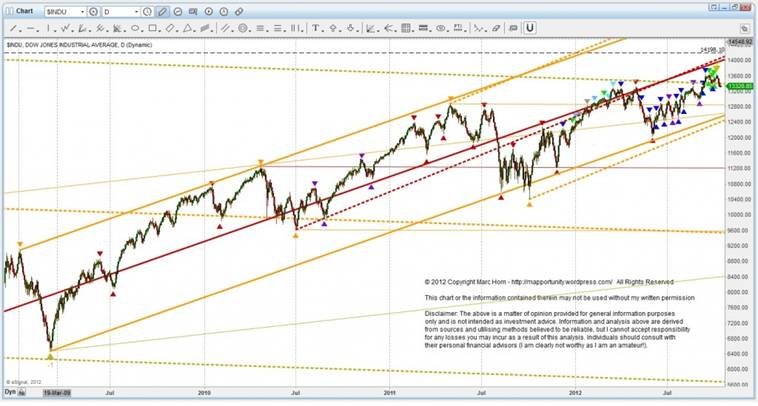
Lets zoom into the final wave detail from the October 11 low
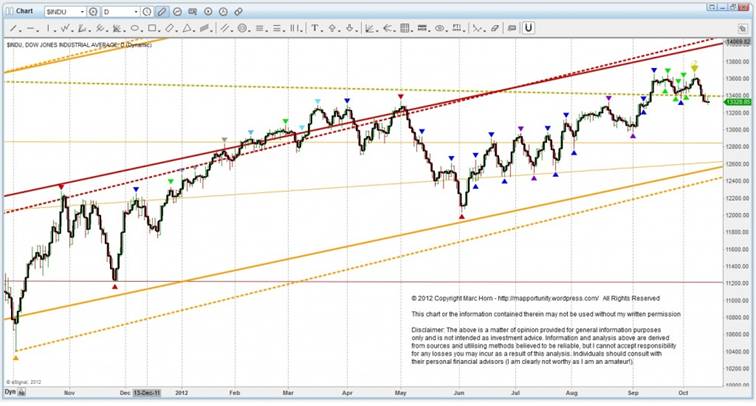
Let me present my case that this is the top of Q-2 – other than the colour it is the same as the one from the article published in March referred to above.
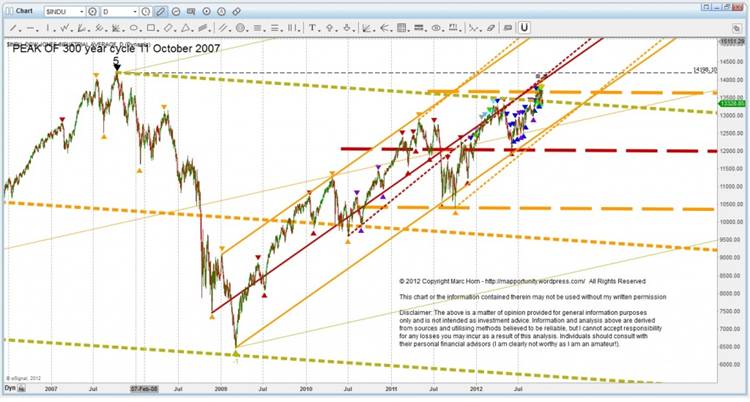
M 1 made a perfect wave turning on Q451ML and M-3-4-5MLH and made a simple correction to M2. God Bernanke was good with QE1 - because this is the ideal reaction point for this pivot off the October 2002 low,, 2007 high and 2009 low! Also it met my rules expected minimum off the 200 high!
Had anyone even heard of him then or was he still with GS? Oh so I hear you all say this is a conspiracy!
M3 turned on the M-3-4-5 MLH but QE2 ran out of steam to cause a break out!
The expected complex correction to M4 overshot the M-3-4-5MLL - think of it as a car suspension - if your shock absorber's are gone and you hit a bump it oscillates back to its neutral position. Or does it? Look back at the first chart and you will see it was supported on the Q012MLL which is from the 1932 low which to me is no surprise - time warped fractal waves - MAP Analysis! I am sure Bennie did not think of Operation twist way back then - was he even born?
M5 Turned just above Q345MLH and is a stones throw away from a perfect cycle of it sling fork to Q-1. Also it is at it next scale down fractal wave M123SP to 4 - again an almost perfect wave cycle!
So lets look at wave M5 off the 2011 low
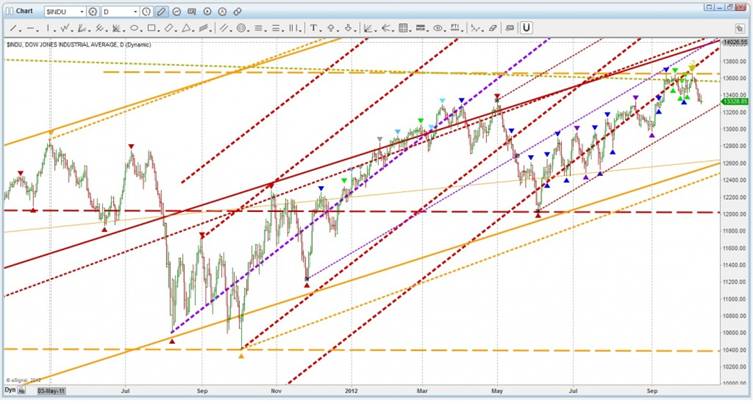
W1 showed good momentum which is not surprising as M4 avershot!. M3 did not make the ML - slowing momentum so expect W5 at WL-1 where sure Q-2 turned! Note how good Bernanke and his European mates are. But hang on this must be a longer term conspiracy as the points used date back to 1932!
I could bore you with a repeat down to 5 more fractal waves scale but you all want to know where to from here?
Depends on what fractal wave scale interest you! Until 2032 shown in the first chart - ideal wave intersection if simple correction just below 2000'ish early to mid 2027. If this is an alternate complex correction just under 200 2032/3.That will be followed by a 300 year bull market.
I hear you say not possible! Every pivot I have shown is through the use of a rule based system - no subjectivity - and if you recall in MAP Analysis Part 3 - A cycle is a repeated sequence of events I believe the main driver of these cycles is our behavior and so unless we change our behavior we are doomed to do the same thing that has happened so far through out our recorded history during sovereign debt crisis- implode within 30 years of the peak - every empire. Go read your history! So short is the way to go - long term bearish!
However most of us like to play a bit in between because if we just went short then we will see our profits see saw and provided we do not fall into the classic traps of waves described in MAP Analysis Part 2 - Trading patterns Explained you will end up loosing most of your money!
The targets shown are thos for ideal waves. They will change as fracturing occurs, however they will always be working back to the bigger fractal wave scale.
W-1 Ideal wave target. Expect to find different fractal pivots on or near every line in between!
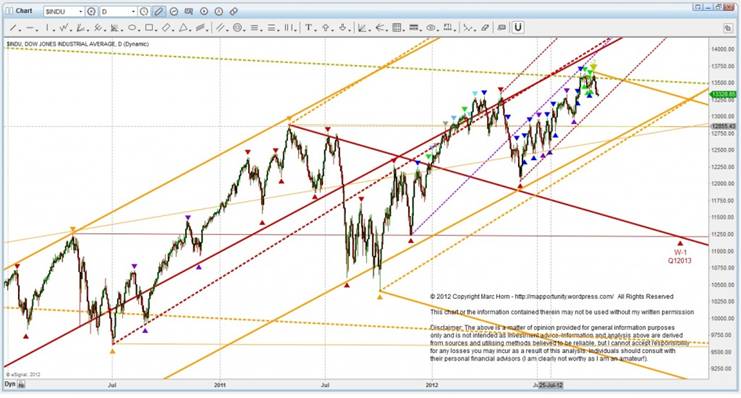
As reasonable fractal waves scale pivots develop I will post updates like before.
Short term - Down 1 or 2 days then up rest of the week to new ML once pivot is made!
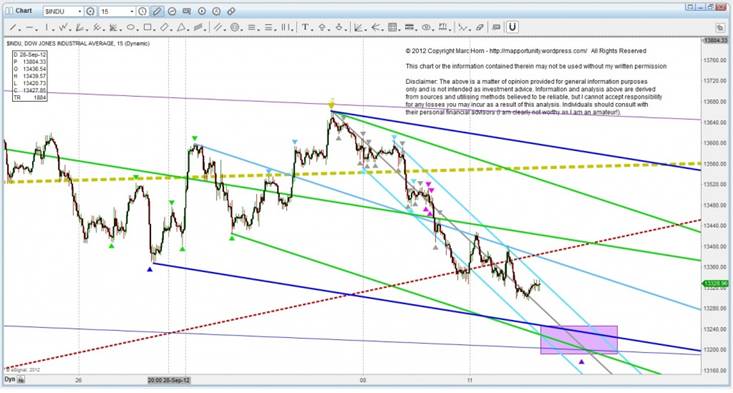
Guess where I am expecting a sizable pivot. The reaction most likely will be a retest of the recent high on the 4H MLU and Wave 3 will be with us no later than the 25 Oct. Notice the lovely wave which reached a slight oversold status only to revert back into its channel - great job Ben and high speed traders and everyone else that is being accused of manipulating the markets!
The correct forks give us a multitude of information, including trend change, momentum, oversold and overbought as well as volatility! From above you can also see that there is going to be a large change in volatility, which is what one would expect in a wave 3.
For more information of how I do what I do http://mapportunity.wordpress.com/ . Comments and discussions very welcome!
The statements, opinions and analyses presented in this site are provided as educational and general information only. Opinions, estimates, buy and sell signals, and probabilities expressed herein constitute the judgment of the author as of the date indicated and are subject to change without notice.
Nothing contained in this site is intended to be, nor shall it be construed as, investment advice, nor is it to be relied upon in making any investment or other decision.
Prior to making any investment decision, you are advised to consult with your broker, investment advisor or other appropriate tax or financial professional to determine the suitability of any investment.
© 2012 Copyright Marc Horn - All Rights Reserved Disclaimer: The above is a matter of opinion provided for general information purposes only and is not intended as investment advice. Information and analysis above are derived from sources and utilising methods believed to be reliable, but we cannot accept responsibility for any losses you may incur as a result of this analysis. Individuals should consult with their personal financial advisors.
© 2005-2022 http://www.MarketOracle.co.uk - The Market Oracle is a FREE Daily Financial Markets Analysis & Forecasting online publication.


