Stock Market Forecast for the Coming Week
Stock-Markets / Stock Markets 2012 Oct 13, 2012 - 12:37 PM GMTBy: Manas_Banerji
 Market is expecting stimulus from China and looks like in this moment that is the one thing that may take markets in more higher levels, this is considering the fact that never ending Euro-zone debt fever is not going to improve much in coming days. Rise in Chinese export for September was good but in coming week Chinese inflation and 3rd quarter growth figures are due to come and those may be huge important events for market. On the other hand expectations are still high about Spanish bail-out and corresponding bond buying by ECB, now it will be very interesting to see whether stock markets get any good thing from that episode.
One thing that I think is very disturbing is the huge amount of liquid money that big companies are holding and not investing! I am not talking about the smart money that data is also not sound but the way big companies remain abstain from using their cash in both organic and inorganic sectors that is not reflecting a sound picture about future.
Without US presidential election I am not seeing anything that can support the rally which stock indexes faced from June this year. Stock indexes are not showing familiar positions on the other hand currency market is also confusing but if we have to make any clear decision then I would say currency market is indicating better picture for stock indexes but that may not be totally for coming week.
Let talk about the stock indexes,
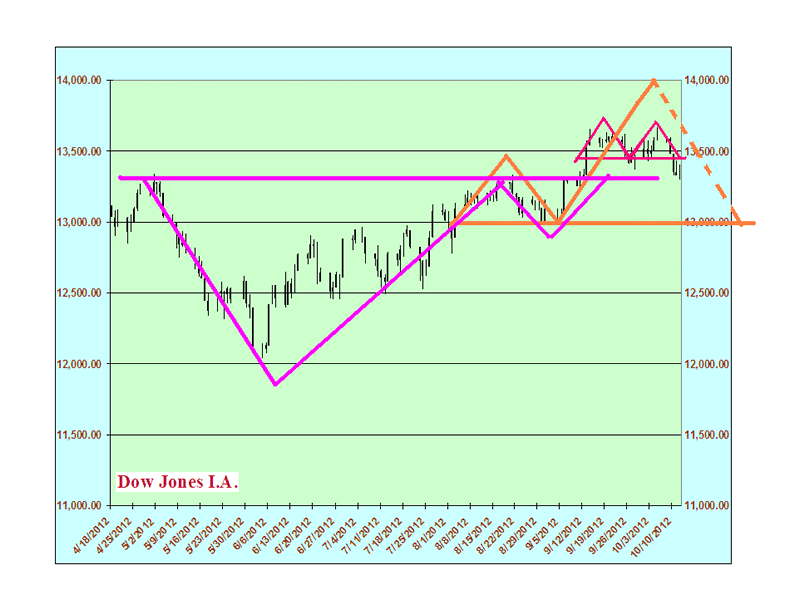
During last few weeks I was suspecting that if Dow Jones I.A. does not able to cross 13600 level then there is a chance that it may react on its short-term bearish pattern, though it has not reacted fully but definitely it does it to some extent.

Last few day’s lows say that it may be looking to make a base here but if it fails to do that then there is a chance that Dow may drop more from here. During last few weeks I was suspecting about a possible middle-term bearish pattern, now if Dow drops more from here and tests around 13000 level then it may be giving strength to that assumption but definitely it needs couple of more days to get an indication of that. In the downside Dow has initial support at 13200 level.
On the other hand if this base around 13300 works well or it reverses back from 13200 level then Dow may again try 13600 levels where around 13500 will be its initial resistance level. Dow has already triggered its bullish pattern and as I said in past that it may take time to react on this pattern because it is not a straight one. If Dow breaks 13600 then 13800 is its next strong resistance, Dow can go up to 14200 if it fully reacts on this medium term bullish pattern.
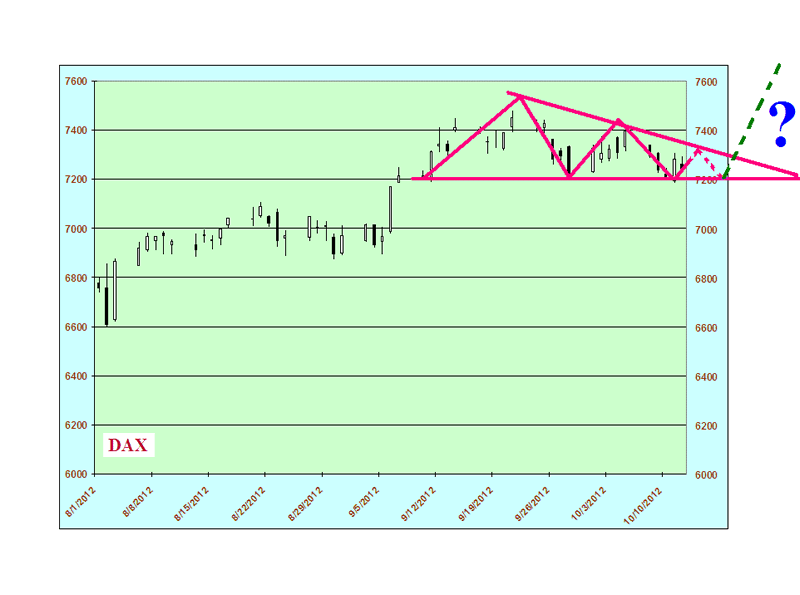
Last week I was talking that if German DAX does not able to maintain 7340 levels in early days then there is a chance that it may drop. Though it did form bearish lower tops but now I think that it may not react like a bearish pattern, in fact it may take couple of more days to continue this moves and looks like that it may break-out from that in coming week. Dax is making these short-term lower tops in medium-term upward market (or descending triangle) then that generally signifies well but there is no guarantee. Even if we consider that the break-out will be in the upside even then I don’t think that it will be a big one, unless Dax breaks out 7500-7600 level convincingly a new bull run is not expected from here.

Long-term position of Dax is not totally clear, it has both the options open so taking a decisive call is difficult. I do not know for sure whether Dax is waiting for a break-out in the upside or it is going to react on that short-term bearish pattern, if that pattern triggers then Dax may test around 7000 level. On the other hand if we go with long-term reversals then it may drop up to around 6600 level (around 61.8% reversal).
Last week I was suspecting that FTSE 100 does not stay above 5830 in early days then it may not test 5900 level. But time has not come yet to talk about of multiple bearish options; I will talk about them when Ftse will break 5650 level in the downside. Ftse is trying to break a crucial trend line which it is following from June, if it breaks that then the bearish view will get strength.
On the other hand if it able to stay above 5800 then it may again try to test 5900 ranges. Here I must say that Ftse has created a complex medium term bullish pattern which indicates that it may try above 6200 level in coming future but I am not too much sure about that. Overall Ftse remains flat during last few weeks but I think so long it stays above 5800 the chance of more up moves is quite expected.
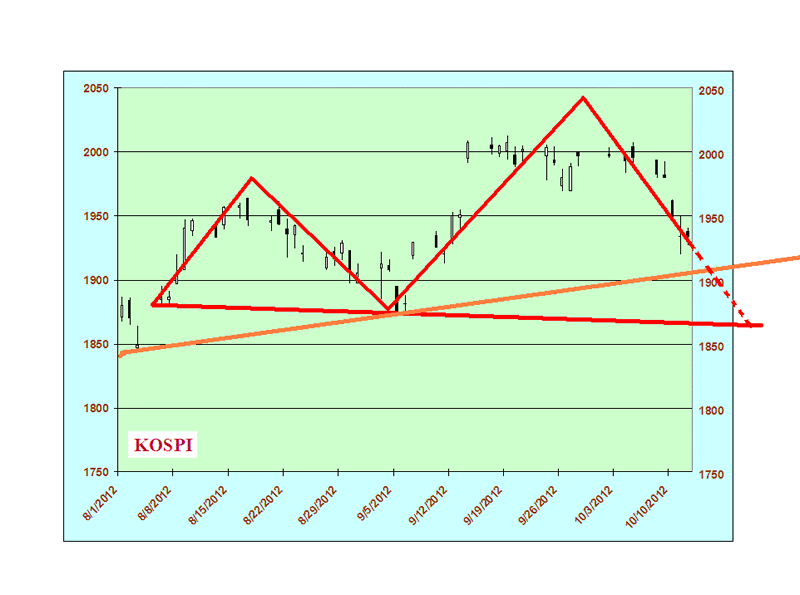
Last week I said that if South Korean KOSPI goes below around 1900 then there is a chance of forming bearish pattern, after this week’s movements that fear looks close. Though the bearish pattern I am talking about is not completely clear yet but there is a probability. We have to wait for more time to get an indication but even if Kospi goes down from here then a small reversal may come, in fact if that bearish pattern is true then that demands a reversal in the upside but that is not definitely above 2000 levels.
Last few days were not good for kospi, though close was better in the last day and looks like it is making a base. But this guarantees nothing because Kospi is not giving any strong figure. Now I will again think about testing 2000 level when it will able to break around 1980 levels in the upside. I will think about a new bull movement for Kospi when it will give stronger moves above 2050 range but for that first it has to break 2050 level in the upside.

S&P/ASX 200 is getting resistance at 4500 level and it is good to see that it got its initial support at 4450 level. Last few days it showed uncertain movements so it is important that S&P/ASX maintains this level. In the initial days of the coming week it may again try to test 4500 level. There is also a chance that it may show couple of flat days in this type of short-term higher levels and that is expected around 4450–4500 levels.
From here if it able to break 4500 level then it is due to act on its medium term bullish pattern, if S&P/ASX acts completely on that then we may see it around 4800 in coming future. If we consider normal success rate of that pattern then S&P/ASX will achieve level above 4600.
On the other hand if it drops down from 4450 level then it will get initial support at 4400 level. The chance of making medium term bearish pattern is still there if S&P/ASX tests below 4300 level in the downside but it may not be a straight one.
Reports due in coming days (from US)
Monday, 15th October, 2012 – Retail Sales, NY State Mfg Index.
Tuesday, 16th October, 2012 – Consumer Price Index, Industrial Production, Housing Market Index.
Wednesday, 17th October, 2012 – New Housing Starts
Thursday, 18th October, 2012 – Unemployment Claims, Fed's Phila. Bus Index, Leading Econ Indicators.
Friday, 19th October, 2012 – Existing Home Sales
About me : I am an active stock trader, I trade on Indian market. I am not a writer but in weekends, I love to spend sometime with it. Though it is an Equity market blog but it also covers Bond & Treasury market as well as currency market.
NOTE : Disclaimer of my blog www.worldequitymarket.blogspot.com is also applicable to the above writing.
© 2012 Copyright Manas Banerji - All Rights Reserved
Disclaimer: The above is a matter of opinion provided for general information purposes only and is not intended as investment advice. Information and analysis above are derived from sources and utilising methods believed to be reliable, but we cannot accept responsibility for any losses you may incur as a result of this analysis. Individuals should consult with their personal financial advisors.
© 2005-2022 http://www.MarketOracle.co.uk - The Market Oracle is a FREE Daily Financial Markets Analysis & Forecasting online publication.


