


Stock Market Technical Breakdowns May Call For More Investor Hedging
Stock-Markets / Global Stock Markets Feb 13, 2008 - 04:01 AM GMTBy: Chris_Ciovacco

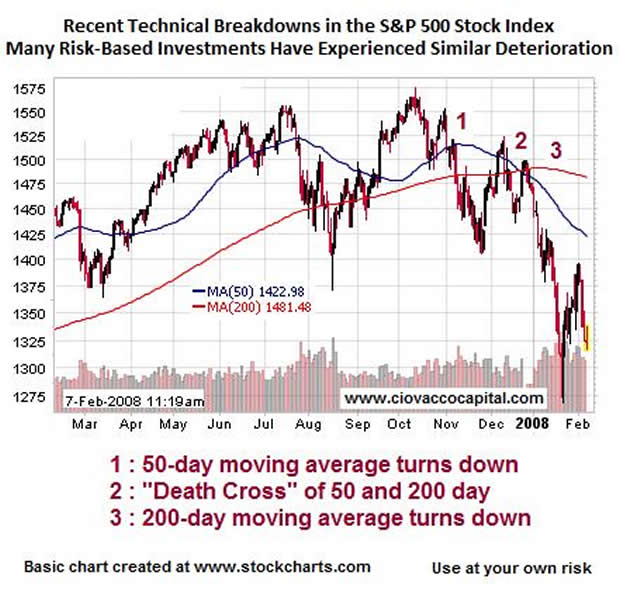
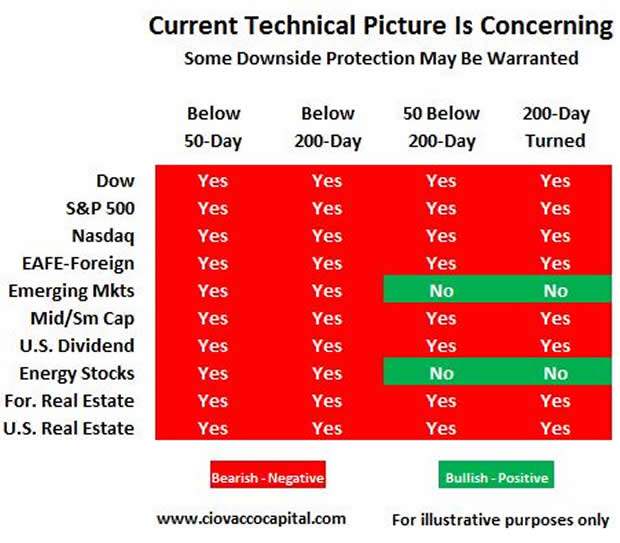
 “I think the necessity of being ready increases.” Abraham Lincoln - Based on recent technical breakdowns in many risk-based investments (see Graph 1), the probability of investors incurring additional losses over an extended period of time has increased. Both the technical and fundamental outlook now favors bearish outcomes over bullish outcomes. In addition to the cash we have raised in recent months, it is now prudent to prepare for the possibility of adding additional hedging vehicles to our portfolios. While favorable outcomes are still possible, they are no longer probable. As illustrated in Graph 2, a continued slow migration away from risk and toward more bearish hedging vehicles may be warranted if conditions continue to deteriorate.
Graph 1
Options Expiration May Boost Market This Week
Without getting into too much detail, it is probable the options market may give asset markets a lift through Friday, February 16, 2008. In recent months, the public and institutions have purchased bearish options in large quantities. When options expire at Friday's close, many firms have to cover the other side of that bearish option, which means they may have to buy bullish options. These somewhat forced purchases can cause an appearance of bullish optimism. Obviously, options expiration is one of many factors which drive the markets, but a strong week followed by a weak open on Monday, February 19, 2008 would not be a big surprise. Therefore, late in the day Friday may offer a good opportunity to make some defensive adjustments to our portfolios.
How To Handle "Dragon Risks"
The term “dragon risks” refers to a period where explorers were afraid of the unknown, such as the fear of falling off a flat world or the fear of a flame-throwing dragon lurking around the corner. With the complexity of today's financial instruments and the real possibility of daisy-chain defaults in the credit markets, “dragon risks” abound. Peter L. Bernstein, one of the most respected authorities on the markets and financial theory, is the author of nine books, including "Against the Gods" and "Capital Ideas Evolving." In a recent 2008 interview with Advisor Perspectives, he stated:"The way to deal with dragon risks is to be hedged. The goal is to survive, and this is more important than a high return. Investors will earn returns over time. But do not get caught with your pants down. I hold a little gold. With the turbulent currency market, the conditions are in place for a dollar crisis. As much as I hate owning gold, I want to survive, so I hold gold. I am diversified as much as possible."
Table 1: As of 2/8/2008
Technical and Fundamental Alignments Are Usually Powerful
The basic goal of any investor is to be overweighted in assets in primary uptrends and underweighted in assets in primary downtrends. How much money you allocate to each asset class is based on the asset class' current risk/reward profile relative to all other asset classes. For example, in a favorable risk/reward environment, it is reasonable to own more stocks than bonds. One of the easiest ways to evaluate the risk/reward profile of an asset class, sector, or region of the globe is to assess both the fundamental and technical outlook for that particular asset class, sector, or region of the globe. Fundamentals refer to topics such as the strength of the economy, corporate earnings, and monetary policy.
Technical analysis uses charts and a host of indicators (a.k.a. technicals) to monitor how the fundamentals are affecting the investment herd's appetite for risk. In terms of getting a good read on the market, the best case scenario is when the fundamentals and technicals are sending the same signals, either positive or negative. Since the goal is to participate in long term investment trends, it is prudent to wait for fundamental and technical alignment prior to making any significant shifts to your asset allocation. With emerging market stocks on the cusp of flipping from a primary uptrend to a primary downtrend, the technicals appear to be close to full alignment with the fundamentals.
Discipline is the Key to Staying with Multiple Year Trends
The bears in the crowd may say, “What took you so long to see what was so obvious?” The answer is investors are always better off waiting for the primary trends to actually change rather than trying to predict when they may change. It is impossible to have a significant and long lasting bear market in any asset class which remains in a primary uptrend. Therefore, it is prudent to wait for evidence clearly showing the uptrend is in jeopardy. There were countless fundamental issues to be concerned about from 1982 to 2000, yet none of them derailed the primary uptrend in stocks. The bears incorrectly predicted the onset of a long term bear market countless times between 1982 and 2000. May of 2006 is another example when the primary uptrends remained in place in the face of weakening fundamentals and a sharp correction in most asset markets. If this is the beginning of a long term shift in trends, we will have plenty of time to profit from the new trend. If a trend lasts for several years, it is not all that important that you be the first one to react to it.
We are not currently declaring a new bear market; we are simply stating at the moment the odds from both a fundamental and technical perspective favor bearish outcomes. The odds of long term bearish outcomes are not yet overwhelming, but they are high enough to warrant the creation of additional defensive contingency plans, which go above and beyond simply adding to our cash positions.
Table 2 and 3 are based on several Ciovacco Capital Management (CCM) studies of current and historical conditions. If conditions continue to deteriorate and 200-day moving averages continue to have a negative slope, we may add a very modest allocation to inverse/bearish hedge investments tied to the asset classes in red above. Further deterioration in emerging market stocks may also call for some exposure to an inverse/bearish hedge.
Table 2
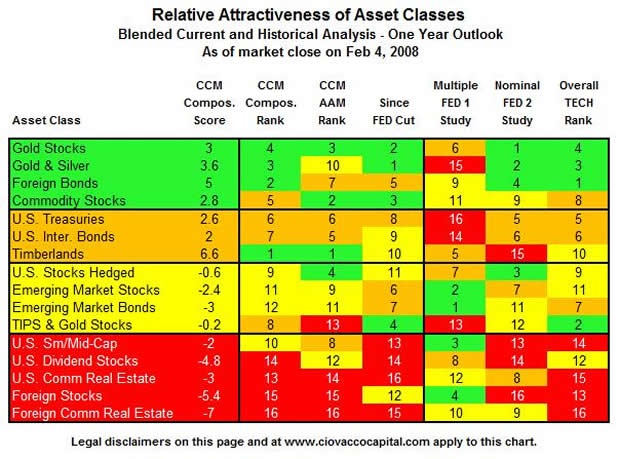
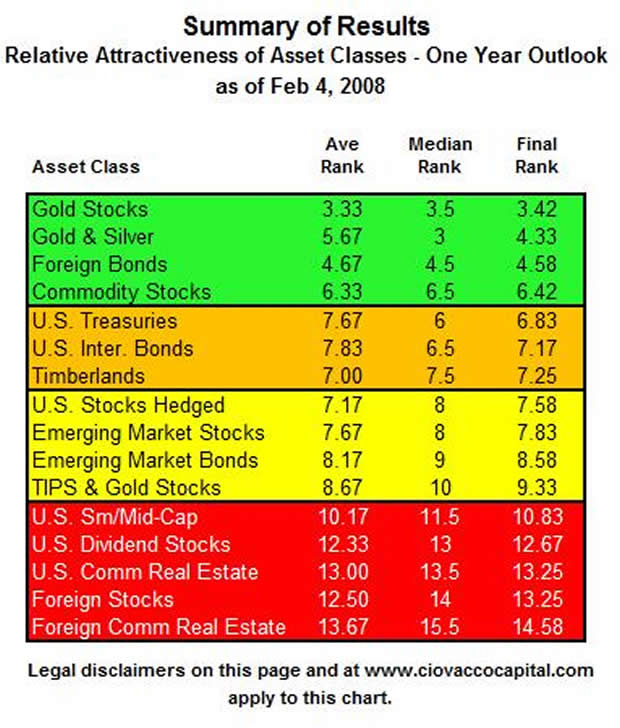
Table 3
The outlook for both U.S. commercial and U.S. residential real estate remains well below average based on a variety of well documented factors. Assume a portfolio has a 1% exposure to a standard U.S. real estate investment, one which makes money in good times for real estate and loses money in bad times for real estate. In an effort to take another preparatory step readying ourselves for the possibility of a longer lasting downtrend, we may add a 1% exposure to an inverse U.S. real estate investment which makes money in bad times for U.S. real estate and loses money in good times for U.S. real estate. In this first step, the 1% positions in polar opposite investments will basically produce a net gain of 0% (one goes up, one goes down).
The rationale for the first move is to give us more options when it comes time. 200-day moving average in 90 days. Our second move might be to decrease our exposure to the standard real estate investment by 0.5% and increase our exposure to the inverse/hedged real estate investment by 0.5%. This means we would now have 0.5% in the standard investment and 1.5% in the inverse/hedged investment. If the following 90 days sees the standard real estate investment lose 5%, we would now have a net gain in our two real estate holdings of 0.05%.
Approximately every 90 to 180 days, we would continue to make small incremental adjustments based on the relative performance between the standard investment and inverse/hedged investment. This approach allows the market to decide which investment to overweight. It will also greatly increase our odds of being allocated properly for the long term trend, whether positive or negative.
Graph 3
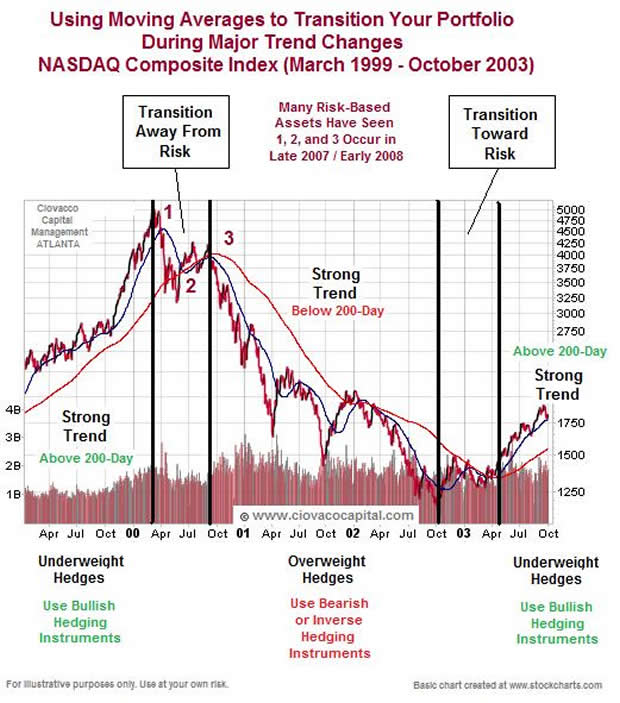
Note the similarity of 1, 2, and 3 in Graph 1 (present) and Graph 2 (2000-2002 bear market).
While we would only use inverse or hedged investments in a diversified portfolio containing a large allocation to traditional, non-hedged, and non-inverse investments, we can illustrate the basic concept using this simplified example. Due to the lack of diversification, the example greatly overstates the magnitude of potential losses and exposure to the inverse/hedged investments.
Table 4: NASDAQ Study Milestones
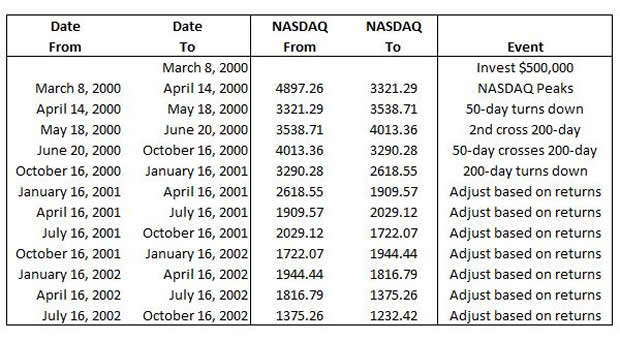
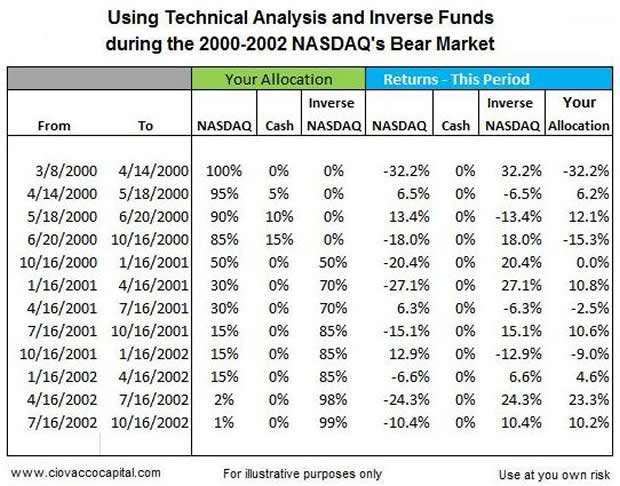
Table 5a & 5b
Assume it is January of 2000 and you have 100% of your portfolio invested in the NASDAQ Composite Index. You are worried the technology bubble may burst soon and have decided to take defensive measures when the charts appear to be signaling a possible change in technology's primary trend.
- We'll start tracking our example on the worst possible day, March 8, 2000, the day the NASDAQ topped.
- You sit tight and take the losses until the NASDAQ crosses its 50-day moving average on April 14, 2000. You have already experienced a loss of 32.18%, but since the primary trend is still up (based on the 200-day moving average), you decide to sell only 5% of your NASDAQ position. Again, the lack of diversification overstates the magnitude of the losses.
- On May 18, 2000, the NASDAQ crosses its 200-day moving average for the second time, which is bearish. You decide to change your allocation to 90% NASDAQ and 10% cash.
- On June 20, 2000, the NASDAQ's 50-day moving average crosses the 200-day moving average. This is known as a “death cross”, which you might surmise is not bullish. Since the 200-day moving average still paints a picture of a rising long-term trend, you only sell 5% more. You are now allocated 85% NASDAQ, 15% cash.
- On October 16, 2000, the 200-day moving average turns down, which could indicate the primary trend has now shifted decidedly negative. Your $500,000 portfolio is down 31.63% since the NASDAQ peaked on March 8, 2000. The NASDAQ is down 46.53%. Due to the technical breakdowns and large losses, you shift to a 50% NASDAQ, 50% Inverse/Hedged NASDAQ allocation. You decide to let the market dictate your next move by comparing the relative performance of the investments in 90-days.
- You repeat the process every 90-days making the allocation adjustments shown in the Table 5 below.
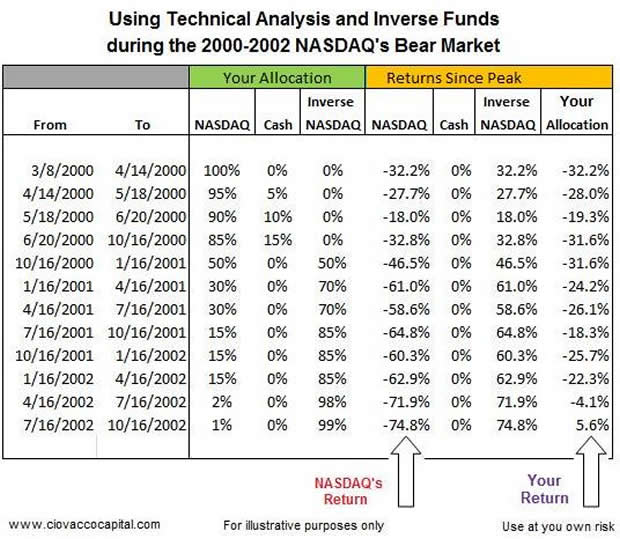
Table 6
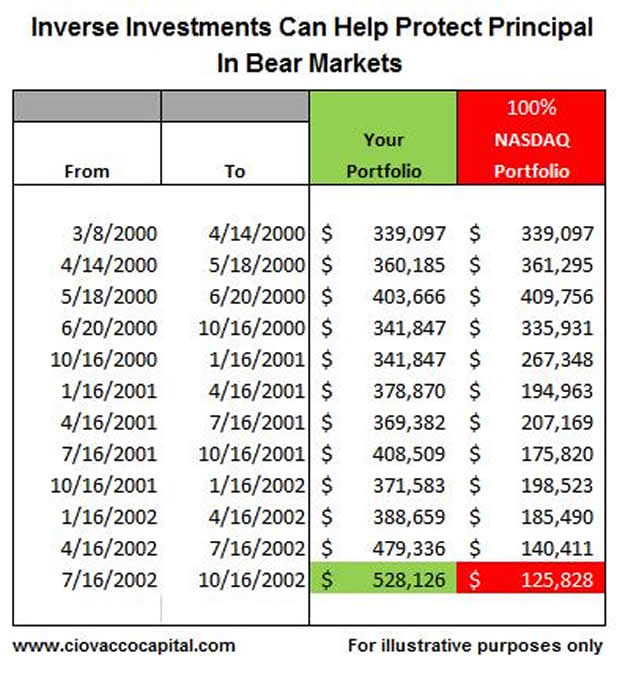
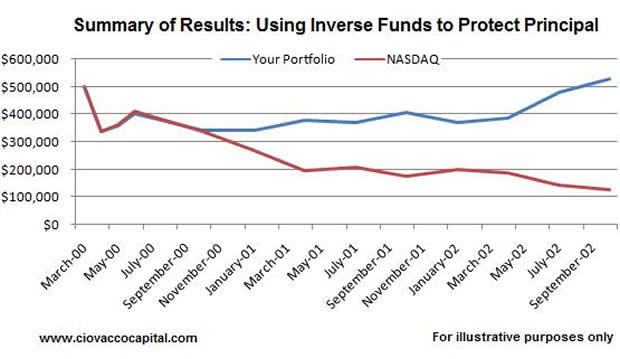
The bottom line results. If you had “waited it out” or “stayed invested for the long-haul”, a buy-and-hold 100% NASDAQ portfolio of $500,000 would have been worth $125,827 on October 16, 2002, which in percentage terms is a loss of 74.83%. Your incremental shift strategy and inclusion of an inverse/hedged NASDAQ position would have left you with a gain of 5.63% or $528,125.
Graph 4
In our real world situation, the vast majority of our portfolios would be invested in asset classes which remained in primary uptrends. Our exposure to inverse/hedged investments would be limited. One of the primary benefits of using the inverse/hedged investments is to enable us to remain close to fully invested rather than being forced to a large cash position. Cash currently has three main risks: (1) inflation, (2) almost non-existent returns in money markets, CDs, and bonds, and (3) even if you move to cash at the right time, you are still faced with the problem of when to reenter the market.
Cash Alternatives after Fed Rate Cuts
With the Fed lowering rates to 3.0%, CD rates have already plummeted and money markets are soon to follow. This coupled with the current volatility and potential risk of further loss in the stock market leaves many asking, “What can I do with my cash?” The choices are living with below inflation rate returns or take on more risk. When the Fed lowers rates below the current rate of inflation, it almost forces people to take on more risk with their cash equivalents. The logical next step-up from CDs and money markets is the 10-Year U.S. Treasury bond. Unfortunately for yield searching investors, fear has driven the annual return on the 10-Year Treasury to a paltry 3.65%. Since living with below inflation rate returns is not appealing in an environment which points toward more monetary and price inflation, a diversified approach is one way to attempt to outpace CDs and money markets without exposing your capital to excessive risk.In an effort to look for cash alternatives, we recently examined:
- The relative attractiveness of a variety of asset classes from U.S. Treasury Bonds to Emerging Market Stocks.
- The relative performance since the Fed first cut rates on September 18, 2007
- The relative performance for the one year period following the last time the Fed cut rates to 3.0% (September 2001). The Fall of 2001 represents the last time investors were first faced with CD and money market rates similar to those we can expect to see in the coming days and weeks. As is true today, in September 2001, investors also had an expectation that rates may move even lower.
- The charts of all the asset classes from both a long-term and short-term perspective.
The results are shown in the Tables 2 and 3 above. Obviously, some of the asset classes shown do not qualify as “cash alternatives”. Therefore, we are running some simulations and optimizations which place reasonable bounds on all the asset classes. Using historical returns from 1970 to 2006, the optimizer and simulator were set to look for the best risk-reward asset allocation using the results in the Tables 2 and 3 above.
CDOs are the Next Shoe to Drop in the Fundamental Arena
The general public has recently become familiar with the term subprime. You may soon become familiar with the terms CDO and credit default swap. CDO stands for Collateralized Debt Obligation. A CDO is an investment-grade security backed by a pool of bonds, loans and other assets. Similar in structure to a collateralized mortgage obligation (CMO) or collateralized bond obligation (CBO), CDOs are unique in that they represent different types of debt and credit risk. In the case of CDOs, these different types of debt are often referred to as 'tranches' or 'slices'. Each slice has a different maturity and risk associated with it. The higher the risk, the more the CDO pays.
The quotes below, taken from 2008 business articles, can help shed light on the role of CDOs and credit default swaps and the risks we still face in the credit markets. The bottom line is more bad news is coming, which will most likely add to the pressure already on the financial markets.
"CDOs package credit-default swaps, bonds or loans and use the income from that debt to pay investors in the CDOs. The value of assets held by CDOs has dropped as losses on mortgage-linked securities increased. Managers now have to buy protection to offset losses, driving credit-default swap indexes higher. Credit-default swaps are financial instruments based on bonds and loans that are used to speculate on a company's ability to repay debt. They pay the buyer face value in exchange for the underlying securities or the cash equivalent should a borrower fail to adhere to its debt agreements. The recent record rise in the prices for credit default swaps indicates worsening perceptions of credit quality."Bloomberg, 2008
"The risk of companies defaulting soared to a record on speculation collateralized debt obligations (CDOs) packaging credit derivatives are being unwound, according to traders of credit-default swaps." Bloomberg, 2008
"European Central Bank President Jean- Claude Trichet said there's no end to financial-market turmoil in sight and policy makers will continue to take "appropriate measures" if necessary. The costs of insuring various forms of corporate debt against default using derivatives rose to records. Banks sitting on $160 billion of unsold leveraged loans may have to write down more losses after a plunge in the value of the debt, according to Bank of America Corp. analysts. "It tells you the credit crunch is intensifying," said Peter Boockvar, equity strategist at Miller Tabak & Co. in New York. "A lot of this paper is sitting on bank balance sheets. There's further potential for more write downs, and that constricts the supply of credit in other areas." Bloomberg, 2008
"With problems spreading from Wall Street to Main Street, America's credit crisis will get worse before it gets better. The Federal Reserve published its latest quarterly survey of bank-lending officers, which showed that the credit crunch was getting even crunchier. According to the Fed, a good number of banks had imposed stricter lending standards and higher rates on loans since the previous survey, carried out in October." The Economist, 2008
"Although bankers are always stingier in a downturn, the Fed noted that lots of banks said they had also cut back lending because of a slide in their current or expected capital and liquidity. For that, blame the chaos in markets for leveraged buy-out (LBO) debt and complex mortgage-backed securities. Blame, too, the state of such bread-and-butter businesses as consumer and commercial-property lending, which are blowing new holes in banks' balance sheets." The Economist, 2008
"Another source of trouble is the moribund market for mortgage-backed securities and that for collateralized-debt obligations (CDOs), which are backed by such securities. On January 30th S&P downgraded or threatened to downgrade more than 8,000 bonds and CDOs, noting that financial institutions' losses tied to them could more than double to a mind-boggling $265 billion. The Fed's loan-officer survey showed that 70% of respondents expect the quality of their credit-card and other consumer-loan portfolios to get worse." The Economist, 2008
"Commercial property is an even bigger headache. True, it is also a problem for Wall Street's finest: for instance, Deutsche Bank recently had to take over some Manhattan buildings belonging to Harry Macklowe, a well-known developer, after he failed to refinance $7 billion of short-term debt used to pay for them. But the property story has a uniquely worrying twist for banks across America. That's because, in addition to offering commercial mortgages, regional and local banks also make huge numbers of “construction loans” to developers building malls, condominiums and other properties. A business the big investment banks pretty much ignored, construction lending was wildly profitable during the property boom, but now a growing number of these loans are turning sour in the bust. Chicago-based Corus Bankshares recently reported that its fourth-quarter earnings were virtually wiped out by a big provision against construction loans." The Economist, 2008
Not All Gloom and Doom
As depicted in Tables 2 and 3, attractive outlooks remain for precious metals, many commodities, and select bonds. My concern, based on history, is that both precious metals and commodities could experience sharp pullbacks if economic and credit conditions continue to worsen. However, we want to hold a base position in both precious metals and commodities since additional monetary inflation should help drive prices higher longer term (maybe much higher). The desire to hold some core positions with attractive long term outlooks is another reason for possibly adding additional hedging strategies to our allocations. Inverse and hedged positions can help offset possible losses in our core holdings in the event we need to ride out continued weakness.Emerging Market Stocks Offer Risk Tolerance Gauge
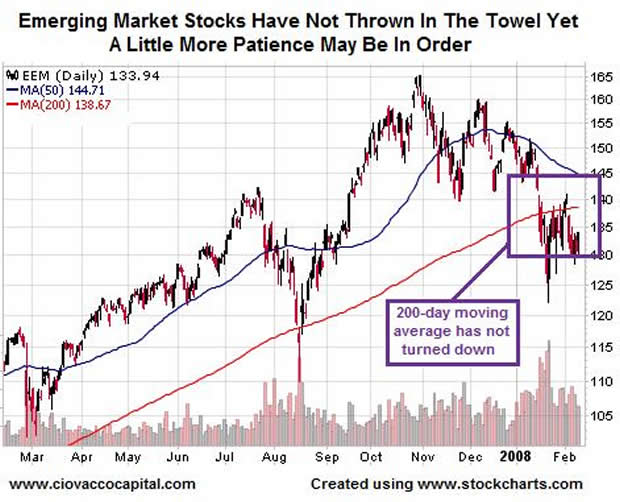
In the late 1990s, the NASDAQ could be used to gauge the average investor's appetite for risk. Today, the emerging markets ETF (EEM) can be used in the same way. If emerging market stocks are healthy, there is still greed overpowering fear in the minds of some investors. As of the market close on Monday, February 11, 2008, EEM is still holding up relatively well. If the 200-day moving average turns down (red line in Graph 5), especially for any extended period, it might represent the last straw on the global stock market's back. The EEM 200-day moving average warrants close watch at this important juncture. If it can remain flat or resume its uptrend, it could foretell a rally in risk assets.
Graph 5: EEM as of close February 11, 2008
"The ability to be cool, confident, and decisive in crisis is not an inherited characteristic, but is the direct result of how well the individual has prepared himself for the crisis." Richard M. Nixon
Chris Ciovacco
Ciovacco Capital Management
Copyright (C) 2008 Ciovacco Capital Management, LLC All Rights Reserved.
Chris Ciovacco is the Chief Investment Officer for Ciovacco Capital Management, LLC. More on the web at www.ciovaccocapital.com
Ciovacco Capital Management, LLC is an independent money management firm based in Atlanta, Georgia. As a registered investment advisor, CCM helps individual investors, large & small; achieve improved investment results via independent research and globally diversified investment portfolios. Since we are a fee-based firm, our only objective is to help you protect and grow your assets. Our long-term, theme-oriented, buy-and-hold approach allows for portfolio rebalancing from time to time to adjust to new opportunities or changing market conditions. When looking at money managers in Atlanta, take a hard look at CCM.
All material presented herein is believed to be reliable but we cannot attest to its accuracy. Investment recommendations may change and readers are urged to check with their investment counselors and tax advisors before making any investment decisions. Opinions expressed in these reports may change without prior notice. This memorandum is based on information available to the public. No representation is made that it is accurate or complete. This memorandum is not an offer to buy or sell or a solicitation of an offer to buy or sell the securities mentioned. The investments discussed or recommended in this report may be unsuitable for investors depending on their specific investment objectives and financial position. Past performance is not necessarily a guide to future performance. The price or value of the investments to which this report relates, either directly or indirectly, may fall or rise against the interest of investors. All prices and yields contained in this report are subject to change without notice. This information is based on hypothetical assumptions and is intended for illustrative purposes only. THERE ARE NO WARRANTIES, EXPRESSED OR IMPLIED, AS TO ACCURACY, COMPLETENESS, OR RESULTS OBTAINED FROM ANY INFORMATION CONTAINED IN THIS ARTICLE. PAST PERFORMANCE DOES NOT GUARANTEE FUTURE RESULTS.
Chris Ciovacco Archive |
© 2005-2022 http://www.MarketOracle.co.uk - The Market Oracle is a FREE Daily Financial Markets Analysis & Forecasting online publication.