Pakistan Investing, Fundamental Economic and Markets Outlook
Stock-Markets / Stock Markets 2012 Oct 01, 2012 - 03:49 PM GMTBy: Bilal_Khan
 In this document we highlight our views on the key investor debates across the macro-economy, FX, fixed income, equities, precious metals and provide our views on asset allocation.
- Economics: Recent improved relations with the US and improved liquidity from the unlocking of USD flows has resulted in a degree of optimism about the future. Will this optimism last given the macro challenges?
- FX: The Pakistan Rupee has weakened by -5.11% vs the USD since 1 January 2012. Will the currency continue to weaken till 31 Dec 2012 and 30 June 2013 in light of significant upcoming external obligations?
- Fixed Income: With the recent shift towards easing monetary policy, what implication does this have for growth and fixed income portfolios?
- Fundamentals - Equity: MSCI Pakistan index is up +21.66% since Jan 2012 and up +108.6% since Jan 2009. In contrast, MSCI Emerging Markets are up +4% and +68% respectively and MSCI Frontier Markets are down -4% and -5% respectively. Should investors be buying Pakistan given this performance and economic headwinds?
- Technical Analysis - Equity: As the KSE-100 makes its first approach to its all time high of 15,700 is a breakout or breakdown the next major move? Several technical studies make a strong case for one outcome.
- Precious Metals: Gold and silver have recently broken out of year long consolidation patterns. Should investors be allocating to this sector? How can the gold/silver ratio help investors maximize returns?
Strategic Asset Allocation Summary

The strategic asset allocation summary is our view on various asset classes based on key debates impacting market dynamics.
Economics – Hinging on USD inflows
Our View: With Pak-US relations on a better footing and progress on unlocking USD flows, FY13 has kicked off with a sense of optimism. That said, key macro indicators suggest significant economic headwinds are in store.
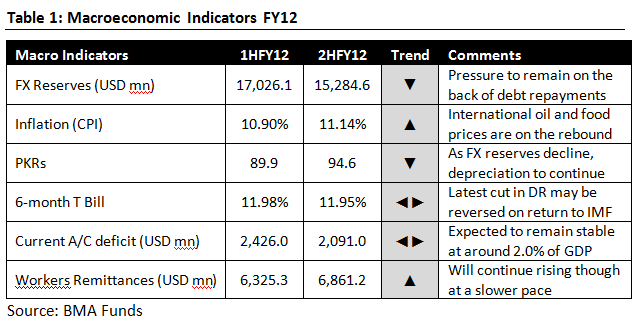
Table 1 provides a directional indication of how some of the key macro variables have performed during each half of FY12. Historically, macro economic instability has been triggered by a crisis in the external account or foreign reserves position – herein lies our core concern.
This concern is reinforced by Moody’s recent downgrade of Pakistan’s foreign- and local-currency bond ratings by one notch to Caa1 from B3 and assigned them a negative outlook. The key drivers for the rating action were; a deterioration in Pakistan's balance of payments over the past year; the looming large repayments to the International Monetary
Fund (IMF); dwindling level of official foreign-exchange reserves and institutional weakness stemming from political instability and constrained government finances.
FX – Further Weakness Ahead
Our View: Latest July data shows the trade balance in deficit territory to the tune of $1.3bn. A widening current account deficit, combined with debt repayment pressures would pose a significant macro risk and lead to weakening currency, tightening of domestic liquidity conditions and increase in capital cost, which would hurt domestic demand. In terms of the Pak Rupee / US Dollar rate, we project depreciation of 9.3% - 10.2% during FY13 as against an actual depreciation of 10.0% in FY12. This could be particularly accentuated in the face of rising oil and food prices as Pakistan’s ability to finance the current account deficit declines.
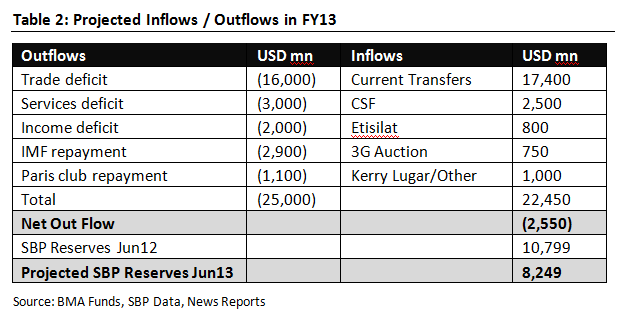
Data in Table 2 highlights probable inflows and outflows along with an expected level of FX reserves which Pakistan will have by 30 June, 2013. This is a result of scheduled outflows due to debt payments and continuing pressure on the current account which would pose macro stability risks to Pakistan. If close to 100% of the envisaged inflows materialize, including the remaining $1.4bn under CSF, then policy makers will have bought themselves another year of macroeconomic stability to push through the much needed reforms. The table above shows that FX reserves would decline by an estimated and manageable $2.55bn (23.6% decline) to $8.25bn during FY13 on the above assumptions.
In the event that the above mentioned inflows do not materialize we project that net outflows during FY13 could amount to $6.0bn which would reduce SBP FX reserves to under $5.0bn. Given the volatile geo political situation in the region the risk of these USD flows not materializing remains high. Reliance on one time external flows that are subject to diplomatic relations puts Pakistan in a precarious position with regards to its balance of payments position. For this reason we believe that a decline in FX reserves could very well prompt a return to the IMF in CY13. The view, therefore, that Pakistan can pay its import bill and have sufficient funds to make debt payments while the surplus on the financial account dwindles to zero is at best misplaced.
Fixed Income - Go long to trade
Our View: Bonds have rallied in the wake of the discount rate cut which has helped the KSE 100 to remain one of the best performing markets in 2012. Of course if we were concerned with only the next 3 – 6 months then this bullish sentiment in the bond, equity and money markets would not be unwarranted. Our view is that investors should take advantage of falling yields by extending their portfolio duration through longer tenors with a view to realizing capital gains at the bottom of the interest rate cycle which we expect to occur during the second half of the current fiscal year. Allocating 15% - 20% of a fixed income portfolio to 5 and 10 year bonds and selling them in 1HCY13 will allow investors to outperform the market.
We believe that the recent reduction in the discount rate by 150 basis points was driven by election year considerations rather than an unbiased view of macroeconomic fundamentals. The premise for the rate cut was single digit inflation which currently stands at 9.05% (August 2012), positive real interest rates and an attempt to boost private sector investment which has fallen to just 12% of GDP. However the cut ignores the fiscal deficit (recorded at 8.5% of GDP in FY12) which is expected to worsen in an election year and the projected decline in FX reserves.
During FY12 the government relied almost exclusively on domestic sources to finance its fiscal deficit. The SBP monetized Rs. 507.5bn ($5.4bn) of deficit spending while scheduled banks extended Rs. 636.4bn ($6.8bn) to the government. Inflationary borrowing from the SBP is particularly worrisome while banks have concentrated investments in sovereign debt and abstained from extending credit to the private sector. Consequently liquidity remains constrained and requires weekly injections from the SBP. These injections are recycled into T bill auctions to keep the interbank market running smoothly.
On the monetary side, the 14.14% increase in M2 during FY12 was either inflationary via deficit monetization or unproductive via bank lending to the government. The government’s debt structure has become increasingly skewed with almost 55% of the government’s Rs. 7.88 trillion domestic liabilities comprised of shorter tenor T bills.
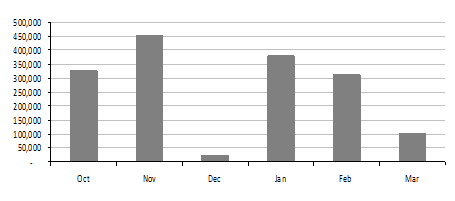
This percentage has been on the rise over the last decade and is up from 31.7% in 2002, 42.4% in 2007 and 49.3% in 2009. This increasing reliance on short term borrowing from banks which has to be refinanced on a regular basis magnifies the roll over risk inherent in domestic debt. It is for this reason that the recent rating downgrade of Pakistani sovereign debt was followed by a similar downgrade for some of the largest banks in the country.
Graph1: Upcoming maturities of GOP domestic debt (PKR bn)
Source: BMA Funds & SBP
The inflation outlook for the coming months appears challenging with food prices and general inflation likely to trend up. The decline in oil since Mar12 has reversed significantly with Arab Light prices having rallied notably from their low in Jun12. At current levels ($ +110/barrel) we would expect a steeper oil bill than the $15.2bn paid out in FY12. Similarly the adverse weather conditions in the US, EU, Australia and India have sent international commodity prices skyrocketing. The weight of food in the CPI basket stands at almost 35.0% and a similar spike in the domestic market would not bode well for the government’s FY13 inflation target of 9.5%. We expect that single digit inflation will continue till the end of CY12 (due to the base effect) after which it will climb back above 10.0%. Thus the window for further discount rate cuts will remain open for perhaps another quarter.
In conclusion, we believe that the current monetary easing cycle is likely to be amongst the shortest in Pakistan’s history. Further, in the event that Pakistan returns to an IMF program, the likelihood of a sharp rise ahead remains a distinct possibility. Policy makers need to be wary of pursuing expansionary monetary and fiscal policies while structural issues continue to drag on growth. In the past we have seen the economy overheating as supply could not keep pace with domestic demand. To revive domestic demand without jeopardizing macroeconomic stability, policy makers will need to focus on structural energy sector reforms, controlling expenditures, boosting tax revenues and increasing productivity. The Government of Pakistan’s (GoP’s) loose fiscal policy has created a monetary overhang that is at the heart of the current situation. Hence, the keyto our interest rate outlook will remain dependant upon the GoP’s efforts at fiscal tightening and procuring the much needed balance of payments support.
Equity – Cheap with Strong Growth
Our View: Despite MSCI EM and FM remaining flat or negative during CY12, Pakistan is up aggressively by over +20% in USD terms. Arguably, and compounded by Pakistan’s macro weakness, Pakistani stocks continue to enjoy the 3 Us which drive our “buy” conviction call on specific stocks – as Pakistani equities continue to remain underloved, underowned and undervalued.
This view is further reinforced by event driven triggers which would allow for an expansion in market and stock multiples. These events include:
- Strong corporate earnings announcements
- Ease in US/Pak tensions
- Opening up of official trade with India
- Further monetary easing
- Continuation of the democratic process
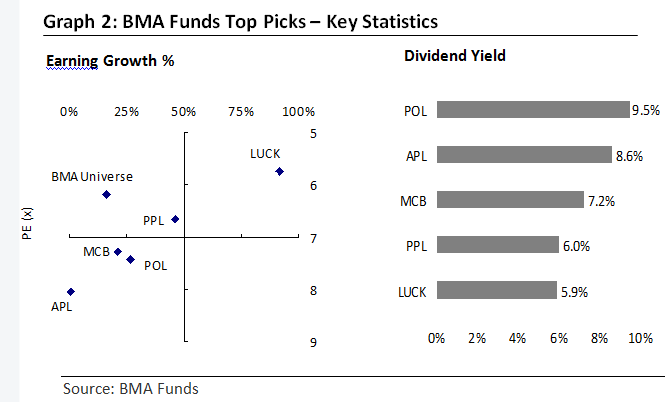
The BMA Funds’ active universe of 19 companies has +26% earnings growth, an 8.7% expected dividend yield and a forward price earnings ratio of 6.3x. A mixed exposure to high yielding and high growth Pakistani equities can present a total return proposition of 15% over the next 6-mths which is attractive when compared with competing asset classes domestically and globally.
The easing in US/Pak relations and the incorporation of the new CGT regime in the Finance Bill has we believe improved sentiment and reduced perceived risk for domestic investors. This is reinforced by recent large transactions in Hubco where Dawood Group and Allied Bank bought and International Power sold a 17.4% stake in Hub Power for $60mn. More recently a consortium led by the Lucky Group acquired a 75.81% stake of ICI Pakistan which was sold by Akzo Noble for a total transaction value of $177mn.
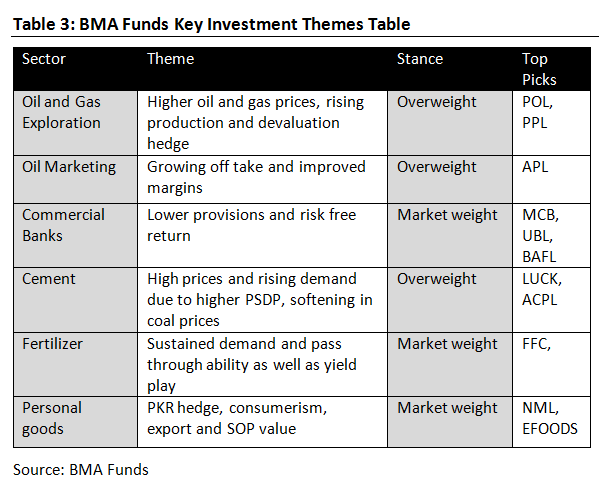
We like sectors supported by Pakistan’s domestic demand and driven by a young and growing population. These are factors which continue to feed growth in staple industries despite weak macro economic indicators. These include Oil & Gas exploration and production, oil marketing companies, large cap banks, cement, independent power producers and the fertilizer sector. Our top picks are Lucky Cement, Pakistan Oil Fields Limited, Pakistan Petroleum Limited, MCB Bank Limited, and Attock Petroleum.
The Technical View: Cyclical Bull Could be Nearing a Top
Our View: For some time now we have been of the view that the KSE-100 is in a secular bull cycle which started in 1998 and should run beyond 2015 to take the index towards the 20,000 level. However, within secular cycles there are also multiple cyclical cycles. Whilst secular cycles are measured in decades, cyclical cycles are measured in years and months.
During the near 4-yr Pakistan bull market there have been four corrections of note with the largest being a -15.7% correction in CY11 which took 8-mths to complete. Once the top is in place, the coming correction could exceed in price and time the -15.7%, 8-mth correction of CY11 which would lead us in to the longest and deepest period of regress since the 2009 bottom.
The latest cyclical bull cycle in Pakistan started after the 2008 bust when the KSE-100 bottomed at 4,800 towards the start of 2009, since then the bull has rallied over +200% (PKR terms) during a near 4-yr period to take the KSE-100 to within 2% of its all time highs at 15,700.
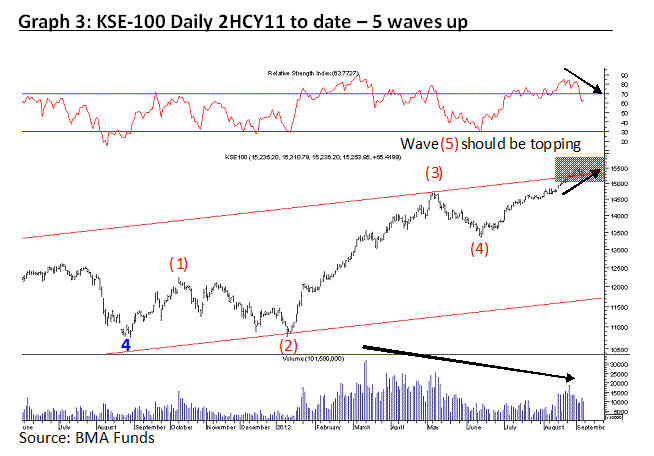
Graphs 3 and 4 show the key technical factors which argue that the KSE-100 could be topping out, these include:
- The KSE-100 is approaching its all time high (15,700) – significant highs and lows act as important resistance/ support levels. The market should react from the 2008 highs at the first time of asking.
- The KSE-100 has been rallying in a 5th wave at two degrees of trend from the ’09 lows so a corrective move lasting several months should be close at hand.
- Multiple Fibonacci relationships highlight a strong cluster of resistance around 15,000 ( 5%)
- Price action has been confined within a bullish price channel since late 2009 and the rally in CY12 has taken the index to its upper boundary. Channel resistance is now in play.
- Momentum and volume are diverging against price on multiple timeframes.
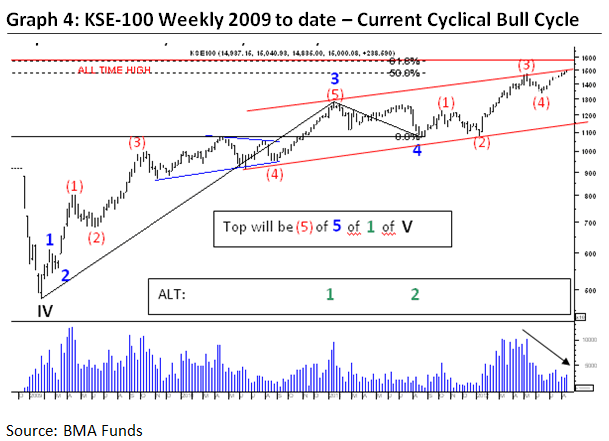
The alternative wave labeling leaves open the possibility that the KSE-100 can continue to rally and tear through the 2008 highs. This is supported by market valuations being 50% lower than at the 2008 high and leverage around 80% lower. However until a breakout is sustained this remains an alternative interpretation of price action.
Precious Metals – New Highs are on the way
Our View: Metals have been in consolidation mode for over 1-yr. Silver topped out in April ’11 and gold in August ’11, since then both metals had been correcting the previous advance and forming a low volatility base which allowed the Average True Range (ATR) to fall sharply. Gold held above major support at $1,525 and silver at $26.6, both have now rallied aggressively since late August leading us to believe that final corrective lows are now in place and a rally to new highs is underway.
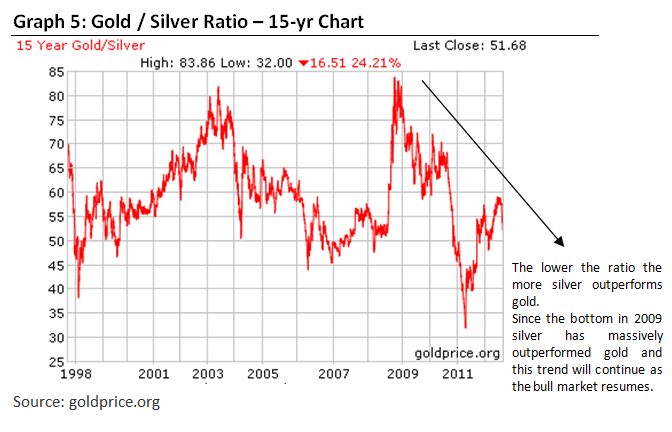
In genuine precious metal moves we always look for silver to lead gold higher and this bull move should be no exception. Since the final lows have been in place silver is +28% whilst gold is +13%, silver is showing clear relative strength adding credibility to the current advance being the start of a new cyclical move higher. The gold/silver ratio currently at 51, has fallen from a high in August of 59 and should continue to trend lower towards the low 30’s as both gold and silver move to new all time highs. Silver will outperform and offer a leveraged play on gold. Traditional metals investors usually only buy gold, and while this strategy generated attractive returns a partial allocation to silver would have augmented portfolio returns. Aggressive investors would be well advised to hold a sizeable quantity of silver as well as gold in order to maximize potential gains from the precious metals bull market.
Risks: What to watch out for
Although we remain cautiously optimistic the chances of the equity bull market being derailed depend on the following risk factors:
- Conflict between US/Israel and Iran would spike international oil prices impacting energy deficient economies;
- EU debt crises spreading from periphery countries to the core of the EU (Germany, France, England) and beyond (Japan, USA) could create panic and induce equity investors to off load their positions;
- Non realization of USD flows would trigger a balance of payments crisis
Energy crises and continuation of circular debt problem;
- Ending of a monetary easing cycle in Pakistan
Opinions expressed in the note are that of the Members of the Research Investment Committee, BMA Funds:
Muddassar Malik | Farrukh Hussain | Bilal Khan | Mustafa Pasha, CFA
About the RIC Report: The Research Investment Committee (RIC) within BMA Funds is responsible for arriving at decisions relating to asset allocation and investment decisions for client assets managed by the Firm. This report aims to present broad investment themes and views held by the Investment Team at BMA Funds in a thorough, easy-to-read format that provides insightful analysis and specific investment ideas across major sectors. Whether you are an institutional investor or a private client, the best way to put the RIC Report to work for you is to talk with a BMA Funds Advisor about specific opportunities that interest you. You can take advantage of our investment platform focused to help you keep your long-term investment plan on track. For further information, please email us on invest@bmafunds.com
Bilal KhanVice President, Investments
BMA Funds
801 Unitower - I.I. Chundrigar Road - Karachi 74200 - Pakistan
Tel: +92 21 111 262 111 - Fax: +92 21 3242 6829 - www.bmafunds.com
© 2012 Copyright BMA Funds- All Rights Reserved
Disclaimer - This publication is for informational purposes only and nothing herein should be construed as a solicitation, recommendation or an offer to buy or sell any fund. All investments in mutual funds and other investment plans are subject to market risks. The NAV based prices of units and any dividends/returns thereon are dependent on forces and factors affecting the capital markets. These may go up or down based on market conditions. Past performance is not necessarily indicative of future results.
© 2005-2022 http://www.MarketOracle.co.uk - The Market Oracle is a FREE Daily Financial Markets Analysis & Forecasting online publication.


