Stock Market Brief Correction Due, then Higher Into November Election
Stock-Markets / Stock Markets 2012 Sep 24, 2012 - 11:03 AM GMTBy: Jim_Curry
 It has been a while since I have posted an article, and - due to some recent email requests - I wanted
to take a detailed look as we move into the latter part of 2012, based upon what the larger time cycles
are currently suggesting. In addition, we will take a look at the shorter-term picture, to see what the
U.S. markets may hold in store in the days/weeks to come.
We will start with the big-picture, and then move gradually down to the smaller timeframes.
The Four Year Cycle
The four-year cycle (chart above) is one of the larger cycles that I track - and is the one that is most
Statistically significant for longer-term traders and investors. It's last bottom is seen as the 3/6/09 low
of 666.79 for the S&P 500, which means that it is currently 895 trading days along from the same.
This cycle is currently in the process of going over a very wide top, and is ideally looking to peak
somewhere between November of this year and the first month or three of 2013.
The next bottom for this four-year time cycle is projected to materialize around late-2013 or early-to-
mid 2014, with a particular focus on the latter timeframe - simply due to the fact that it is the next
scheduled low within the 'presidential cycle' pattern. The presidential cycle pattern denotes that the
various U.S. stock indexes are normally weaker in the two following years after an election (here,
2013 and 2014), and then is strongest the next two years. We are certainly seeing this right now, with
the S&P 500 at or within earshot of making it's highest high from the four-year time cycle's last low.
With the above then said and noted, the four-year 'time' component has a strong correlation with peaks
and troughs from the presidential cycle pattern. And, with that, we can also assume that both are due
to peak again in the coming months, with November, 2012 into early Spring of 2013 being a current
range of focus, which I will go into more in just a bit.
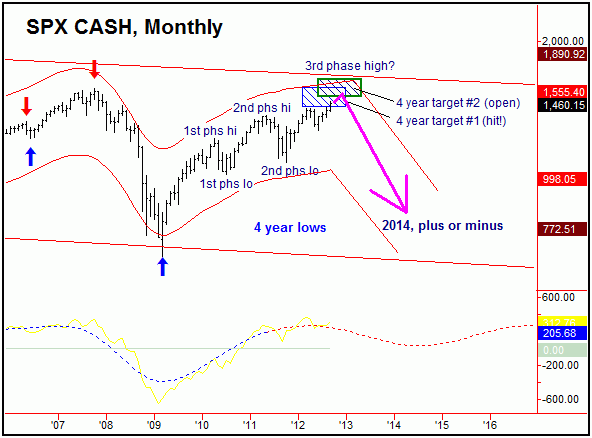
In terms of price, back in November of 2010 the four-year cycle had confirmed it's original upside
target to the 1423.17 - 1591.25 S&P 500 region (chart above), which I originally posted on a prior
article here back in early-2011. Despite the various up-and-down gyrations along the way, this
Target range has been met with the recent action, satisfied back on 8/21/12.
Even with the above said and noted, I should add that back in February of this year a second upside
target was then confirmed with this four-year cycle to the 1504.17 - 1625.83 area on the S&P, and -
until proven otherwise - the current assumption is that this target will be hit before the current
upward phase of this wave is complete.
In terms of patterns, we know from the history of this four-year cycle that it will usually take the
shape of a 'three phase' affair, normally consisting of three smaller sub-cycles - each averaging
around 18-months (or 360-day trading days). Of secondary note is that approximately 85% of these
will peak in either the second or third upward phase. The first upward phase topped at the 4/26/10
high of 1219.80 SPX CASH and then bottomed with the last 360 day low that was made on 7/1/10
at 1010.91. The second phase then topped at the 1370.58 high seen back on 5/2/11 - and then
bottomed at the 1074.77 swing low, seen on 10/4/11. That puts us in the third upward phase at the
present time - and the one that should eventually top this four-year component.
Until a higher level should materialize, it would currently take a reversal back below the 6/4/12
bottom of 1266.74 to actually confirm a peak in place with the four-year cycle; however, that number
should continue to move higher as we move along. If and when this four-year wave does top out,
then of note is that it's average downward phase has witnessed a drop of 35.4% off it's peak, taking
a range of 7-16 calendar months before bottoming. In terms of time, the next bottom for this
component seems to have the best odds for materializing around the Autumn of 2013 or into early-
to-mid 2014, the latter of which - as noted earlier - also lines up with the next scheduled low for the
aforementioned ‘presidential cycle' pattern.
The 360 Day (18-month) Cycle
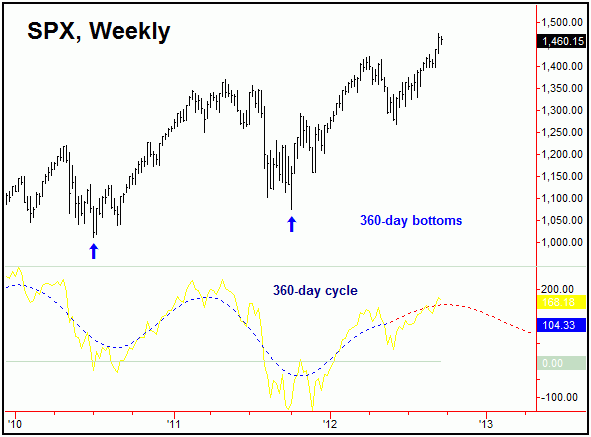
The 360-day cycle (chart, above) is currently seen as 245 days along from the 10/4/11 low of
1074.77, and is regarded as bullish into the month of November or later. It's next bottom is ideally
projected to occur with the larger four-year cycle, which, as mentioned above, is due anywhere
around the mid-to-late 2013 or the early-to-mid 2014 timeframe.
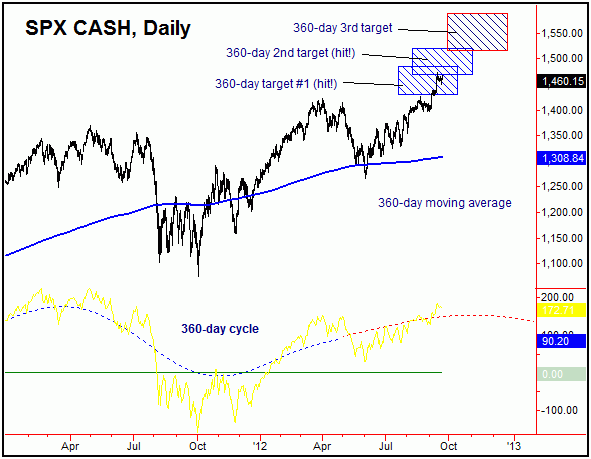
In terms of price, earlier this year the 360-day cycle had confirmed several upside targets, with the
first being to the 1427.63 - 1486.25 area on the S&P, which was met back on 9/6/12. There was
also a second target confirmed with this same cycle to the 1462.64 - 1514.80 area, which has also
been met with the recent action. Going even further, a few weeks back this 360-day wave then
confirmed an even higher (and a third) upside target to the 1514.88 - 1588.24 region on the S&P,
and with that the current assumption is that this zone will be traded into on or before this cycle peaks
in November of this year (or later).
In terms of time with the above, when this 360-day wave registered the pattern of a 'higher-low' into
a 'higher-high' in the past, the average upward phase that followed with lasted 285 trading days
before it's next high was set in place. With that, the inference has been for the current upward
phase of this component to last into November or this year or beyond, then to set up the next longer-
term peak - which should be the high for the even-larger four-year component.
On the back-end with the above, I should also add that approximately 80% of the upward phases this
360-day cycle have topped on or well before the 370 day mark - which gives above-average odds that
it's next high will be made on or sometime well before March of next year.
Stepping back then, once the next 360-day cycle peak is set in set in place (ideally, on or after
November of this year), then it's average decline - when coming off the pattern of a 'higher-high' -
has been around 18.9% from peak-to-trough. In terms of time, that same downward phase averaged
approximately 136 trading days before bottoming, or about 7 calendar months. This does give us some
idea of the expected downside following the next peak for this 360-day component, though it should
be considerably higher than this 18.9% average - simply due to the fact that the next 360-day bottom
will ideally be the low for the larger four-year wave (where that statistical average is 35.4%).
The 180 Day (9-month) Cycle
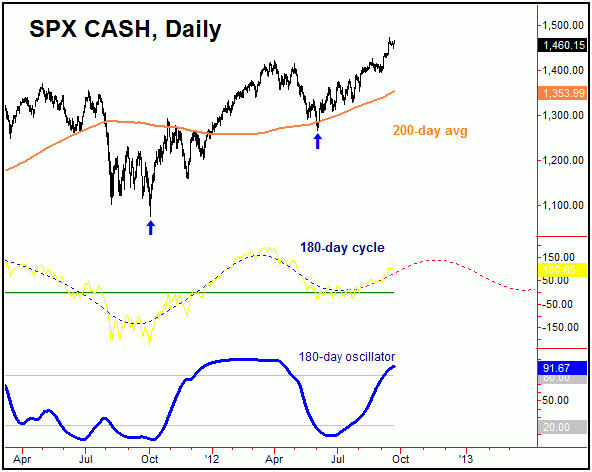
The 180-day cycle (chart, above) is seen as 77 days along and is currently labeled as bullish, with it's
last bottom being the 6/4/12 low of 1266.74 on the SPX. Like the larger 360-day wave, this cycle is
projected to remain in a bullish configuration into the month of November or later.
In regards to time with the above, when coming off the above noted pattern of a 'higher-low', the
average rally phase of this 180-day component lasted around 112 trading days before topping. With
that, the inference has been for the current upward phase of this wave to last into the month
of November or later, then to set up it's next peak. On the back end, approximately 85% of these
have topped on or before the 163 day mark, which probably gives this cycle lower odds of getting
past mid-January of 2013 before it's next high is set in place.
With the above said and noted, if we assume the next peak with this 180-day cycle will be made
between November of this year and mid-January of 2013, then the following downward phase should
see, at minimum, a drop back to the 200-day moving average or lower. In terms of time, the next
bottom for this 180-day component is currently projected to materialize around late-Spring of 2013
(i.e., mid-to-late April), though with a large plus or minus variance in either direction - simply due to
the size of the cycle itself.
Stepping back even further, from what is looking to be a late-Spring, 2013 bottom with this 180-day
cycle, a rally with the same is likely to materialize into early-Summer, 2013. That rally may or may not
make higher highs for the larger swing, with the probabilities currently leaning in favor that it won't -
simply due to the statistical considerations from the aforementioned 360-day cycle. Regardless, a peak
with the 180-day wave around the Summer of 2013 should then give way to a hard decline
into the Autumn of 2013, then to set up the next potential low with the larger 360-day and four-year
components.
The 90-day (20-week) Cycle
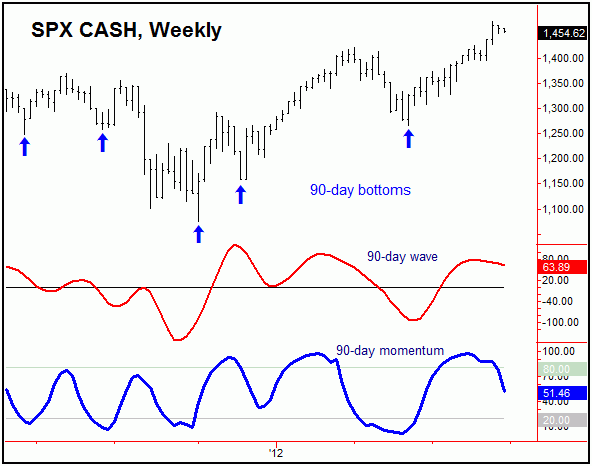
Continuing to move down in the cyclic configuration, like the larger 180-day wave the 90-day cycle
(chart, above) is seen as 77 days along and is currently regarded as neutral. This cycle's last bottom
was the 6/4/12 low of 1266.74 on the SPX, with the current upward phase well into extended range
for a high - and with that is due to turn south into a correction at any point.
In terms of time with this cycle, approximately 90% of the upward phases of this wave have peaked
on or before the 81 day mark. And, since we are now 77 days along, the inference is that this cycle
either topped at the 1474.51 figure (from 9/14/12), or, alternately, will be seen on any push to new
highs that might materialize in the coming days.
In taking a look at the momentum oscillator that tracks this particular cycle (blue, chart above) we
can see that it is slowly turning south. Momentum usually precedes price, and with that the suggestion
is that this cycle is ready for a correction, which should give us the next good swing low on the
daily chart.
With the above said and noted, the downside 'reversal point' for 90-day cycle is currently any daily
close back below the 1425.90 figure on the S&P 500, though I will also make the suggestion that
even an intraday push below 1448.50 on this index, if seen, may start to lean the odds in favor of
this cycle's correction phase to be in force. In terms of price, once this 90-day wave does top, the
downside 'risk' (or potential reward, if short) is to the 70-day moving average or lower. In terms of
time, the next downward phase of this component is expected to be fairly quick, likely
lasting only a week or two off it’s high.
Stepping back, the current assumption is that the next downward phase of this 90-day cycle - if and
when seen - will hold at or well above the June bottom of 1266.74 on the S&P - meaning that it
Should register the pattern of a 'higher-low'. And, when this pattern has been seen in the past, the
Following upward phase of this wave has about 80% odds of taking out it's prior peak - which
Simply means that the S&P should make new highs for the year into what is looking to be the
November election.
The Bottom Line
The bottom line with all of the above is that the larger 180-day, 360-day and four-year time cycles
are pointing higher into November of this year - but which could push out into the first month or two
of 2013. In terms of price, there are various remaining targets to the low-1500’s or better for the
S&P 500. Having said that, in-between, we are well overdue for a correction with the smaller 90-
day component, which is currently well-extended from it’s early-June bottom. That correction, once
in play, is likely to be fairly quick, lasting only a week or two off the peak - with support now at the
1375-1400 area. From whatever low that is seen with this 90-day component in the days/weeks
ahead, the current expectation is that the following upward phase will take the various U.S. Indexes
higher into and out of the November election, then to set up for yet another hard correction of a few
weeks - prior to turning higher again into year-end, simply based upon normal seasonal patterns.
Jim Curry - Market Turns Advisory
Website 1: http://cyclewave.homestead.com
Website 2: http://www.stockindextimer.com/
Jim Curry is the editor and publisher of Market Turns advisory, which specializes in using cyclical analysis to time the markets. To be added to our mailing list click HERE
Copyright 2012, Jim Curry - Disclaimer - The financial markets are risky. Investing is risky. Past performance does not guarantee future performance. The foregoing has been prepared solely for informational purposes and is not a solicitation, or an offer to buy or sell any security. Opinions are based on historical research and data believed reliable, but there is no guarantee that future results will be profitable. The methods used to form opinions are highly probable and as you follow them for some time you can gain confidence in them. The market can and will do the unexpected, use the sell stops provided to assist in risk avoidance. Not responsible for errors or omissions.
© 2005-2022 http://www.MarketOracle.co.uk - The Market Oracle is a FREE Daily Financial Markets Analysis & Forecasting online publication.


