


Stock Market Signaling Intermediate Term Low and End to Short-term Correction This Week
Stock-Markets / US Stock Markets Feb 11, 2008 - 02:46 AM GMTBy: Andre_Gratian

 Current Position of the Market
SPX: Long-term trend - Election years that fall in the 8th year of the Decennial pattern call for consolidation in the early part of the year followed by a strong finish. But the 6-yr cycle which is scheduled to bottom in late Summer/early Fall could also play a restraining role, followed by an eventual bull market top in 2009-2010.
SPX: Intermediate trend - an extended intermediate-term consolidation is in process.
Analysis of the short-term trend is done on a daily basis with the help of hourly charts. It is an important adjunct to the analysis of daily and weekly charts which determines the course of longer market trends.
Daily market analysis of the short term trend is reserved for subscribers. If you would like to sign up for a FREE 4-week trial period of daily comments, please let me know at ajg@cybertrails.com .
Overview
The rally from SPX 1270 ended its 126-point advance to 1396 last week when it met with resistance at the top of its main down-channel, and it has since retraced to a former support level at about 1320 where it has been building a base for the past three days. Although it could still dip a little lower next week as a short-term cycle makes its low, it appears ready to resume its uptrend and challenge its recent high.
The Banking index retained its gain better than the SPX in this correction, and so did the Russell 2000 to some lesser extent. This is significant, because it may signal that this is only a pull-back and not the resumption of a major decline.
The positive reading of many important indicators are suggesting that we are in the middle of an intermediate correction, not at the beginning of a bear market. For this to remain so, the SPX must not drop below the key level of 1236.
What's ahead?
Momentum:
On the daily SPX chart, you can see clearly why the rally ended where it did: right at the top of the down-channel which is the path of the intermediate trend. The decline has confined itself to the top half of the channel, each time bouncing off the mid-channel line, and has now retraced to a former support level (dashed red line). If we stop in this area, the odds of breaking out of the channel on the next attempt at a rally are fairly good, but that will not necessarily mean that we have resumed the long-term uptrend. We may remain in a trading range for several more weeks, and could even resume the down-trend if this proves to be only the beginning of a bear market (not favored at this time).
The indicators at the bottom of the chart are currently neutral. They had become slightly overbought and have now corrected to their mid-range, but are still in a short-term uptrend. The SPX action in the early part of next week will decide if we are ready to resume the uptrend, or need more consolidation.
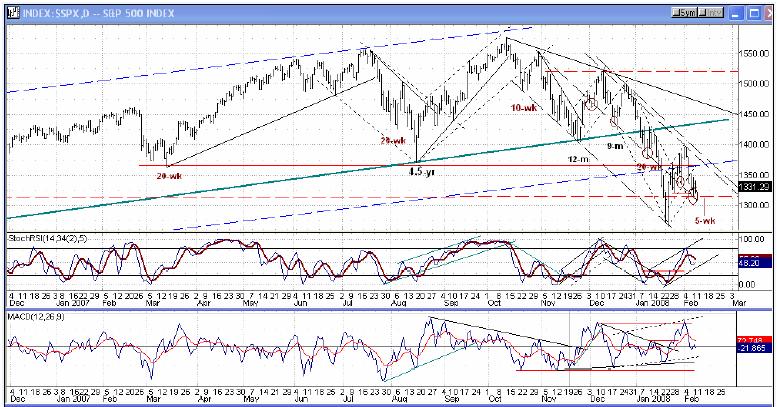
Intermediate indicators are still in a basing pattern and have not yet given a buy signal.
Cycles
Recently, Peter Eliades (Stock Market Cycles) stated that he had discovered two important long-term cycles that might account for the recent market action by bottoming at the end of January. If he is correct, this will be no more than an intermediate correction. The next important cycle is the Hurst 9-month cycle due to bottom in April. Since this agrees with the time frame of the seasonal pattern of election years, we may have to wait until then for the correction to end. However, we need not see lower prices, but could form an extended trading range pattern before the indices can resume their long-term uptrend. But the market will still have to contend with the 6-yr cycle which is due later on this year.
Next week, the Hurst 5-wk cycle is due to make its low. If it does not bring much more weakness, odds are that we will be back in an uptrend by the end of the week.
Projections:
When the SPX broke below 1363, it triggered a Fibonacci projection zone of 1236 to 1286. This was mentioned in the last newsletter. Another important Fibonacci count taken another way gives a target of 1236. This makes 1236 a key level. Since it has not been seriously challenged yet, it is entirely possible that 1270 will turn out to be the low of the correction. Also, the price and volume action when the SPX reached that level was climactic -- huge volume and sharp reversal.
The current pull-back from 1396 represents a .618 retracement of the rally from 1270. Since it coincides with 1323 which has already proven itself as a support level, there is a good chance that last week's low of 1316.75 will hold. It was touched briefly intra-day but the index rallied immediately. Because the 5-wk cycle low is still ahead, and If last week's low does not hold, the next two likely targets for a reversal are 1310 and 1296.
The base projections to 1424 and perhaps 1468 have not been invalidated by this decline.
Breadth
I am really impressed by the performance of the Summation Index in this decline and rally, and I don't see how it could be interpreted in a way other than bullish. Here is the latest reading (courtesy of StockCharts):
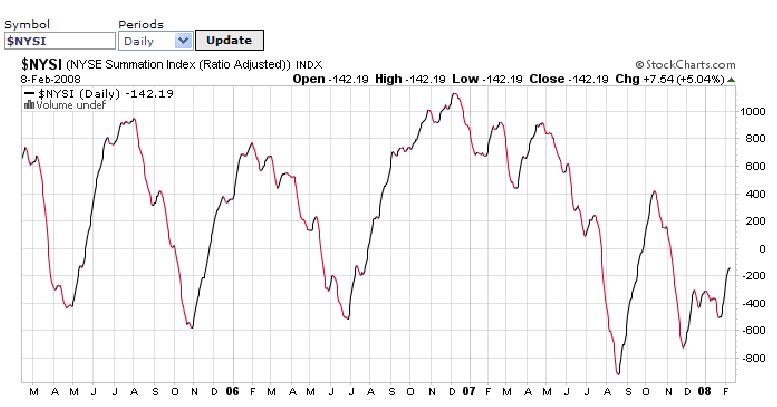
The index made its low in August, tested it successfully in November and again in January, each time making a higher low. The positive divergence has steadily increased and it is now attempting to get back in an uptrend. As long as this continues, it can only suggest that the market has probably seen its low.
Market Leaders and Sentiment
Most indicators are bullish:
- The Banking index and the Russell 2000 have become relatively stronger than the SPX lately and the NDX has remained above its long-term trend line.
- Sentiment indicators range from bullish to neutral
- In January, the Insider Index was more bullish than during any month in 2007.
Summary
Most indicators are suggesting that we are making an intermediate-term low, but could remain in a trading range for several more weeks.
The indices have been correcting after their initial rally from the 1/23 low, but that correction could be over by this week.
A market advisory service should be evaluated on the basis of its forecasting accuracy. This is probably the best all-around value. Two areas of analysis that are unmatched anywhere else - - cycles and coordinated Point & Figure and Fibonacci projections -- are combined with other methodologies to bring you weekly reports and frequent daily updates.
The following are examples of unsolicited subscriber comments:
What is most impressive about your service is that you provide constant communication with your subscribers. I would highly recommend your service to traders. D.A.
Andre, You did it again! Like reading the book before watching the movie! B.F.
I would like to thank you so much for all your updates / newsletters. as i am mostly a short-term trader, your work has been so helpful to me as i know exactly when to get in and out of positions. i am so glad i decided to subscribe to turning points. that was one of the best things i did ! please rest assured i shall continue being with turning points for a long while to come. thanks once again ! D.P.
But don't take their word for it! Find out for yourself with a FREE 4-week trial. Send an email to ajg@cybertrails.com .
By Andre Gratian
MarketTurningPoints.com
A market advisory service should be evaluated on the basis of its forecasting accuracy and cost. At $25.00 per month, this service is probably the best all-around value. Two areas of analysis that are unmatched anywhere else -- cycles (from 2.5-wk to 18-years and longer) and accurate, coordinated Point & Figure and Fibonacci projections -- are combined with other methodologies to bring you weekly reports and frequent daily updates.
“By the Law of Periodical Repetition, everything which has happened once must happen again, and again, and again -- and not capriciously, but at regular periods, and each thing in its own period, not another’s, and each obeying its own law … The same Nature which delights in periodical repetition in the sky is the Nature which orders the affairs of the earth. Let us not underrate the value of that hint.” -- Mark Twain
You may also want to visit the Market Turning Points website to familiarize yourself with my philosophy and strategy.www.marketurningpoints.com
Disclaimer - The above comments about the financial markets are based purely on what I consider to be sound technical analysis principles uncompromised by fundamental considerations. They represent my own opinion and are not meant to be construed as trading or investment advice, but are offered as an analytical point of view which might be of interest to those who follow stock market cycles and technical analysis.
Andre Gratian Archive |
© 2005-2022 http://www.MarketOracle.co.uk - The Market Oracle is a FREE Daily Financial Markets Analysis & Forecasting online publication.