


Stock Market Elliott Wave Analysis Update
Stock-Markets / Stock Markets 2012 Aug 28, 2012 - 02:01 AM GMTBy: Tony_Caldaro

 After making a new bull market high on tuesday, SPX/NDX, the market immediately pulled back into the upper 1390′s before recovering on friday. For the week the SPX/DOW were -0.70%, and the NDX/NAZ were -0.15%. Asian markets were -0.7%, European markets were -1.6%, and the DJ World index declined 0.3%. On the economic front the numbers were quite even. On the uptick: existing/new home sales, durable goods orders and the WLEI. On the downtick: FHFA housing prices, new home prices, the monetary base and weekly jobless claims rose. Overall the pullback looked quite contained and normal for this stage of the current uptrend.
LONG TERM: bull market
On tuesday the SPX/NDX, futures driven, indices made new bull markets highs. Yet, the DOW/NAZ, more cash driven indices did not. This major index divergence set the stage for the first significant pullback since the first week of the month. Nevertheless, new bull market highs in the indices, plus new highs in market breadth and a 5-year low in the VIX, suggest the bull market has further to go.
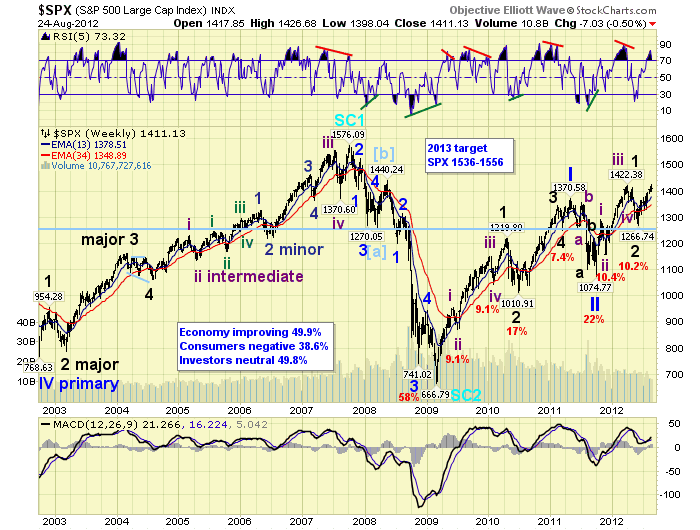
Our weekly chart continues to display a gradually rising market with positive technicals. The RSI is currently overbought and probably working its way back to the 90 level. The MACD is on a positive slope and has generally remained above neutral the entire time. The wave count remains unchanged, with the market still in Primary wave III after completing Primary waves I and II in 2011. Notice Primary I divided into five Major waves, with Major wave 1 subdividing into five Intermediate waves. Primary wave III appears to be following the same exact wave structure. Our Major wave 3 target remains the 1499 pivot range by year end. Plus, we expect the bull market to end in mid to late 2013 between SPX 1536 and 1556.
MEDIUM TERM: uptrend
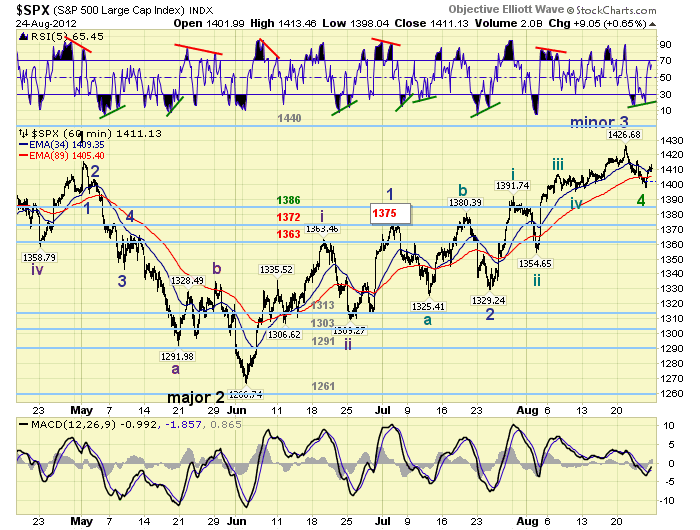
Medium term support remains at the 1386 and 1372 pivots, with resistance at the 1440 and 1499 pivots. The internal count we have been tracking for this Major wave 3 uptrend continues to unfold fairly well. Major wave 3 is naturally dividing into five Intermediate waves. Intermediate waves i and ii completed at SPX 1363 and 1309 respectively. Intermediate wave iii has been underway since that low. Intermediate wave iii is subdividing into five Minor waves. Minor waves 1 and 2 completed at SPX 1375 and 1329 respectively. Minor waves 3 and 4 appear to have recently completed at SPX 1427 and 1398. Minor wave 5, to complete Intermediate wave iii, should be underway now.
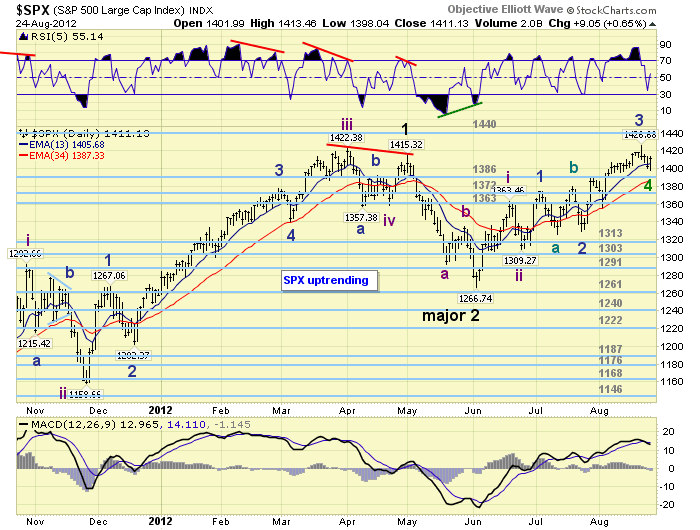
Initially we had a target of the OEW 1440 pivot range for Minor wave 3. This was based upon Minor wave 3 equaling a fibonacci 1.618 times Minor 1 at SPX 1436. The wave appears to have ended less than 10 points from this target. However, we can now extract a series of interesting rally relationships from the entire uptrend. Intermediate wave i and now Minor wave 3 both rose 90+ points: 96 and 98. While Minor wave 1 and Minute wave i (of Minor 3) rose 60+ points: 66 and 63. This rally pattern suggests Minor wave 5 is most likely to rise 60+ points, or less likely 90+ points. Should the recent SPX 1398 low hold for Minor wave 4, this projects Minor 5/Intermediate iii will likely top in the SPX 1460′s area. Also, at SPX 1469 we have a fibonacci Int. wave iii = 1.618 times Int. wave i. As a result we lower our original SPX 1470 target for Intermediate wave iii to 1460-1470.
SHORT TERM
Short term support is at SPX 1402/03 and the 1386 pivot, with resistance at 1413/15 and 1422/27. Short term momentum touched overbought on friday after creating a positive divergence. The short term OEW charts are now positive, with the swing point at SPX 1409.
The recent fourth wave pullback fits with the chartacteristics of this bull market. First and third waves have been rather strong, with weaker fifth waves. Second waves have been rather strong, with weaker fourth waves. During the current uptrend we have had strong first, second, and third waves, with thus far a weaker fifth and two weak fourth waves. Wave characteristics also suggest friday’s SPX 1398 low may have ended Minor wave 4. Even a further pullback into the OEW 1386 pivot range would not be too much out of the ordinary. However, anything more than that and this uptrend begins to run into some difficulty.
We have been carrying a lower probability uptrend count on the DOW hourly chart. This count suggests only Intermediate wave A ended at the early June downtrend low. And, Intermediate wave B has been unfolding during this uptrend. Minor A, in this count, was quite simple: DOW 12,035 – 12,899. A simple flat Minor B followed to DOW 12,450. Then a Minor C ending diagonal triangle, fitting perfectly within a rising wedge, completed at DOW 13,331 on tuesday. The initial break was about 300 points to DOW 13,027. Then after the positive divergence the DOW rallied to 13,176 on friday. With the Tech stocks rallying after a 2-year cycle low, new all time highs in market breadth, a 5-year low in the VIX, the USD in a downtrend, and Bond rates in an uptrend, we give this count a low probability. Otherwise it would portend a fairly nasty downtrend decline back to DOW 12,000.
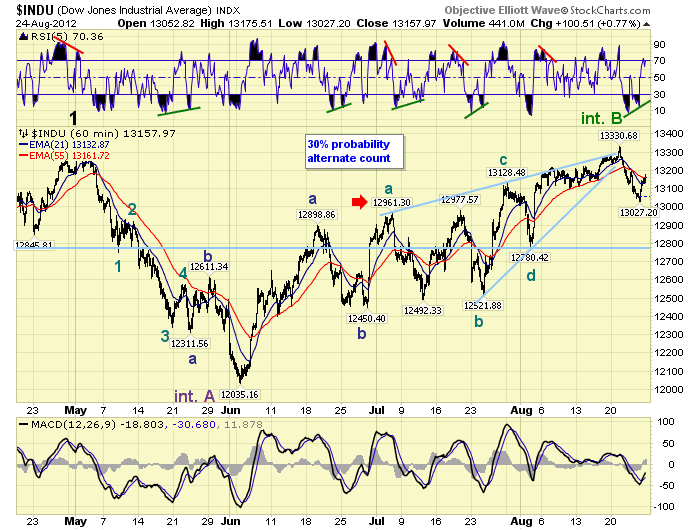
Should the SPX break the OEW 1386 pivot range, and then break 1375, the probability of this alternate could would increase from 30% to the preferred count. Should the DOW make new highs, above DOW 13,331, this count would be eliminated. Should the pullback resume just keep two numbers in mind: 1386 and then 1375. Best to your trading!
FOREIGN MARKETS
The Asian markets lost 0.7% on the week, and all but China remain in uptrends.
The European markets lost 1.6% on the week, and all indices remain in uptrends.
The Commodity equity group gained 0.1% on the week, with all indices still uptrending.
The DJ World index lost 0.3% on the week and is still uptrending.
COMMODITIES
Bonds rallied 0.8% this week in an ongoing downtrend. 10Yr rates hit 1.86% before declining to end the week at 1.68%.
Crude had a choppy week after an extremely overbought condition: +0.4%.
Gold finally got a decent uptrend going as it rallied 3.5% on the week.
The USD confirmed a downtrend and lost 1.2% on the week.
NEXT WEEK
All market pundits will be tuning into Jackson Hole on friday (Bernanke speaks 10 AM), and saturday (Draghi speaks). But before that there is some important economic reports being released. On tuesday: Case-Shiller and Consumer confidence. On wednesday: Q2 GDP (est. +1.6%), Pending home sales and the FED’s Beige book. On thursday: weekly Jobless claims, Personal income/spending, and PCE prices. Then on friday: Chicago PMI, Consumer sentiment and Factory orders. The FED has nothing else scheduled except the Jackson Hole Economic Symposium. Best to your weekend/week!
CHARTS: http://stockcharts.com/...
http://caldaroew.spaces.live.com
After about 40 years of investing in the markets one learns that the markets are constantly changing, not only in price, but in what drives the markets. In the 1960s, the Nifty Fifty were the leaders of the stock market. In the 1970s, stock selection using Technical Analysis was important, as the market stayed with a trading range for the entire decade. In the 1980s, the market finally broke out of it doldrums, as the DOW broke through 1100 in 1982, and launched the greatest bull market on record.
Sharing is an important aspect of a life. Over 100 people have joined our group, from all walks of life, covering twenty three countries across the globe. It's been the most fun I have ever had in the market. Sharing uncommon knowledge, with investors. In hope of aiding them in finding their financial independence.
Copyright © 2012 Tony Caldaro - All Rights Reserved Disclaimer: The above is a matter of opinion provided for general information purposes only and is not intended as investment advice. Information and analysis above are derived from sources and utilising methods believed to be reliable, but we cannot accept responsibility for any losses you may incur as a result of this analysis. Individuals should consult with their personal financial advisors.
© 2005-2022 http://www.MarketOracle.co.uk - The Market Oracle is a FREE Daily Financial Markets Analysis & Forecasting online publication.