


The Help Wanted Index vs. the US Recession Question ...
Stock-Markets / US Stock Markets Feb 06, 2008 - 12:47 AM GMTBy: Marty_Chenard

For years, I have followed the government's Help Wanted Ad numbers. The Help Wanted Ads are a precursor as to what will be happening on Employment in the future. As such, it is an important indicator to watch relative to recession questions.
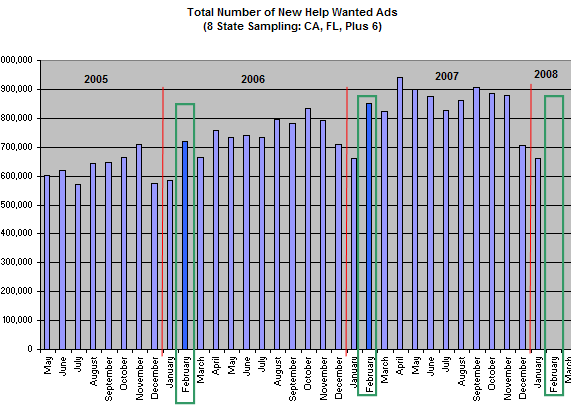
I created this chart on Saturday that shows the Help Wanted data going back to 2005. What is noteworthy, is that for the past 2 years, the December and January Help Wanted numbers have all shown a drop over the October/November numbers. The big event has been February, where the Help Wanted ads zoom up higher than the preceding 2 or 3 months.
(Posted February 1st. on our paid subscriber update)
** NOTE ** This is what we want to watch for at the end of February. If the numbers come in with a similar rise to the past, then that would suggest that we will avoid a recession ... or the worse is already past ... and the stock market will act in concert to the upside with a strong rally. See chart 2 ...
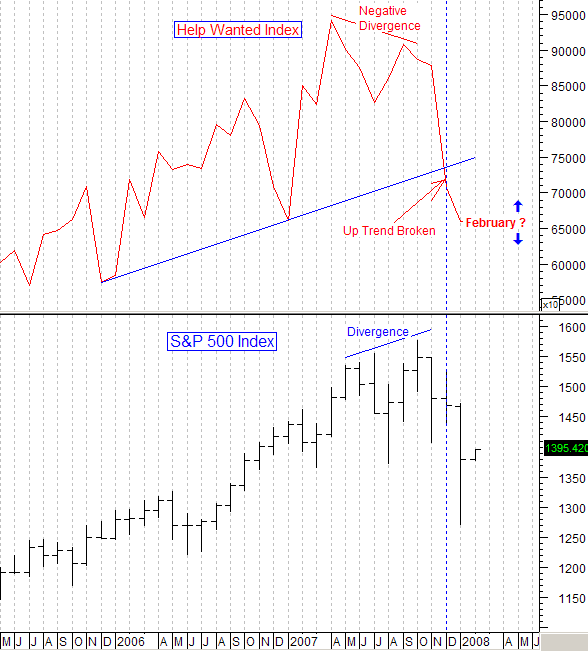
How does the Help Wanted Index track with the S&P 500?
The Help Wanted Data from the above bar chart was plotted on a monthly S&P 500 chart below. (The data is released in the beginning of month for each preceding month.)
Note that it was in December that the Help Wanted Index fell ... and it fell below its support line . Is this why Institutions started selling in January?
What is important now, is what happens relative to February's Help Wanted Advertising. Will it drop again, or will it jump up like the two past years?
(The February data and chart will be posted on our paid subscriber site just as soon as it is released in early March.)
By Marty Chenard
http://www.stocktiming.com/
Please Note: We do not issue Buy or Sell timing recommendations on these Free daily update pages . I hope you understand, that in fairness, our Buy/Sell recommendations and advanced market Models are only available to our paid subscribers on a password required basis. Membership information
Marty Chenard is the Author and Teacher of two Seminar Courses on "Advanced Technical Analysis Investing", Mr. Chenard has been investing for over 30 years. In 2001 when the NASDAQ dropped 24.5%, his personal investment performance for the year was a gain of 57.428%. He is an Advanced Stock Market Technical Analyst that has developed his own proprietary analytical tools. As a result, he was out of the market two weeks before the 1987 Crash in the most recent Bear Market he faxed his Members in March 2000 telling them all to SELL. He is an advanced technical analyst and not an investment advisor, nor a securities broker.
Marty Chenard Archive |
© 2005-2022 http://www.MarketOracle.co.uk - The Market Oracle is a FREE Daily Financial Markets Analysis & Forecasting online publication.