


Position Yourselves for Stock Market Collapse Crash or 10 Year Breakout
Stock-Markets / Stock Markets 2012 Jul 25, 2012 - 08:29 AM GMTBy: Chris_Vermeulen

 As mentioned last Friday just before things took a dive on the weekend, a look at the major market indices did not look promising. If we take an even longer term look and examine the monthly charts we can see that The S&P 500 as well as the Dow Jones have been approaching multi-decade rising channel resistance lines. Further, they also appear to be forming bearish rising wedge patterns.
Monthly Long Term Chart Analysis & Thoughts:
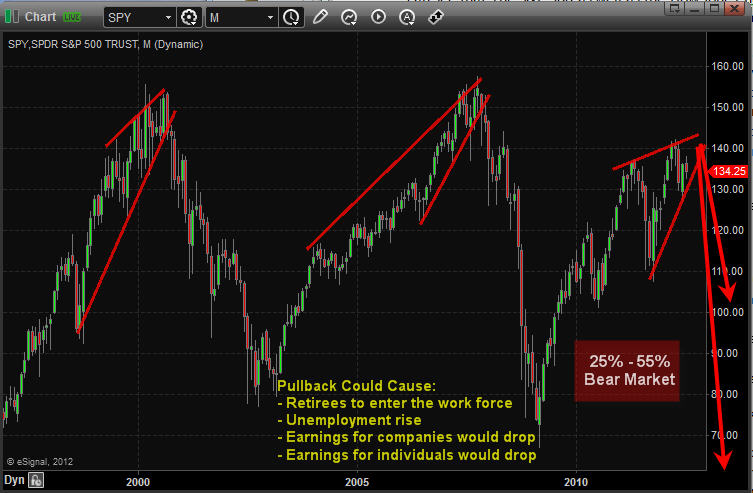
As many of my longer term subscribers can attest to, I always preach that technical analysis is one part art and one part science: you can never be completely certain on what the outcome of a pattern is going to be. However, we can use historical analysis to make better investments. The great American Novelist Mark Twain probably said it best in that “history does not repeat itself, but it rhymes”. Regarding a rising wedge pattern, we know that roughly two-thirds of the time they will break to the downside. This also means that one-third of the time they break to the upside.
In accomplishing our goal of capital growth we must do a number of things. We must make returns on our investments, we must protect our investments, and we must limit our losses. While all three aspects work in tandem with each other, there are times when focus must be allocated to one specific approach.
Regarding the current technical setup, I’m not so focused on the 67% chance that these wedges will break to the downside, but more so the impact of each outcome on the average Joe’s portfolio and mom and pop businesses. The S&P 500 and the Dow are approaching long term resistance lines that have been in place for decades. If we do break to the downside, which I suspect we will, there could be a very significant sell off with consequences that no one can predict at this point though I mention some things in the chart above. Alternatively, there is significant overhead resistance in the various indices, and I don’t believe an upside break would be too monumental.
That being said, I always like to keep an open outlook and wait for the right opportunity. I’m trying to think of scenarios that would prelude further upside action and I really am not coming up with much. As evidenced by the completion of the recent 5 wave uptrend on the S&P that coincided nicely with the various quantitative easing policies, Ben Bernanke and the fed have had less and less impact. I truly can’t see many fiscal developments that would prompt any significant bullish action.
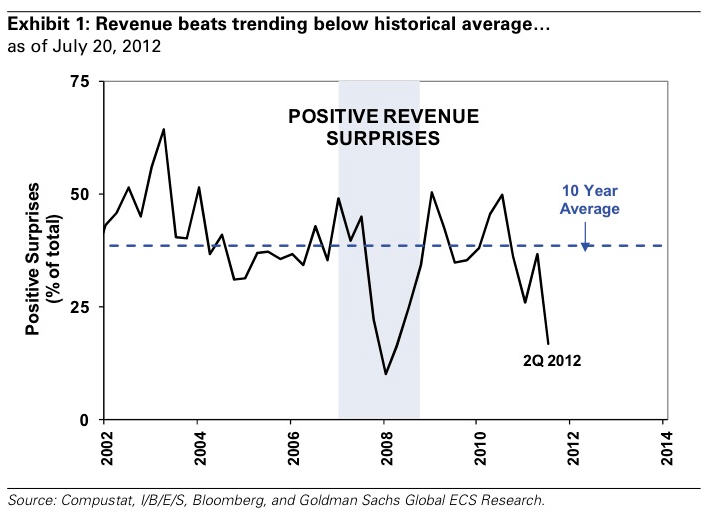
The only scenario I really think that could pump up equities is a series of positive earnings announcements. A lot of expectations, earnings numbers, guidance, etc… have been revised downwards over the last couple of quarters, so there is the opportunity for some positive surprises that could lead to some bullish price action. In absence of such a scenario, I really can’t think of much else that would prompt a run up.
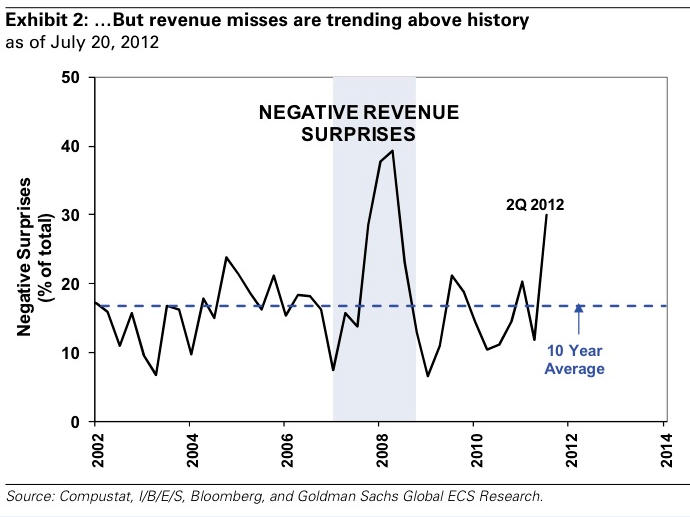
Look at these charts of positive and negative earnings surprises… and the dates and remember what happened following this negative data….
Positive Earnings Surprise
Negative Earnings Surprise
That being said, I am recommending two courses of action. For those steadfast bulls, lock in some profits and/or buy some protection. Missing out on some of the upside is a lot better than losing some of the gains you have fought so hard for over the past couple of years. For the more aggressive traders and investors, start following my updates a little more regularly as I foresee many shorting opportunities coming up in the future. As many of you know, sell-offs are often quick and abrupt, and timing is extremely important when playing the downside.
Further, trading could get very volatile in the near future. Historically, and even more so looking forward as August and September have been very costly for the average investor. Our focus will be in taking the highest probability trades that offer the best risk to reward scenarios. There will be times when we miss trades, and times when they’re not timed perfectly. But, as those who have been with me for a while can attest to, patience pays off in the long run…
Find out more on gold cycles and trading at www.GoldAndOilGuy.com
By Chris Vermeulen
Chris@TheGoldAndOilGuy.com
Please visit my website for more information. http://www.TheGoldAndOilGuy.com
Chris Vermeulen is Founder of the popular trading site TheGoldAndOilGuy.com. There he shares his highly successful, low-risk trading method. For 6 years Chris has been a leader in teaching others to skillfully trade in gold, oil, and silver in both bull and bear markets. Subscribers to his service depend on Chris' uniquely consistent investment opportunities that carry exceptionally low risk and high return.
This article is intended solely for information purposes. The opinions are those of the author only. Please conduct further research and consult your financial advisor before making any investment/trading decision. No responsibility can be accepted for losses that may result as a consequence of trading on the basis of this analysis.
© 2005-2022 http://www.MarketOracle.co.uk - The Market Oracle is a FREE Daily Financial Markets Analysis & Forecasting online publication.