Tech Stocks Signal Bearish Move for Stock Market
Stock-Markets / Stock Markets 2012 Jul 11, 2012 - 04:51 AM GMTBy: Steven_Vincent
 Today's intraday pop and drop reversal contributes to the growing picture of bearish tape action more consistent with a C wave decline. We are starting to see "good" news, such as recent announcements from the EU, either ignored or actually sold, whereas bad news is being hit hard, such as AMD's profit warning. Alcoa announced an earnings beat and it intially popped and then got crushed for -3.3% on big volume:
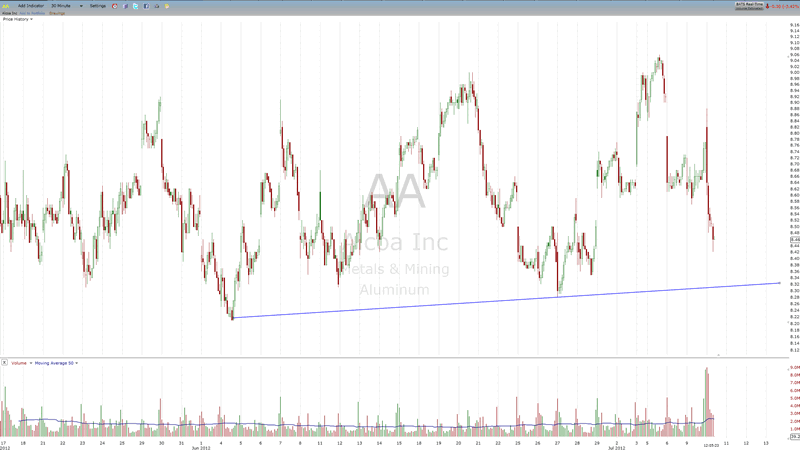
It's also interesting that while the news media were reporting about the beat last night, there has not been a single mention of the selling onslaught today.
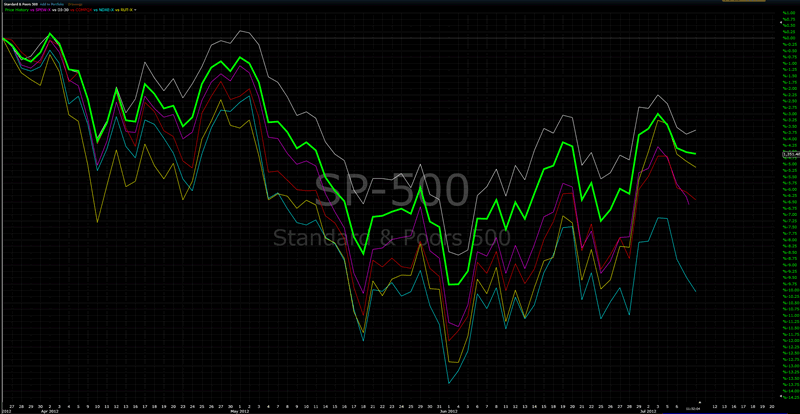
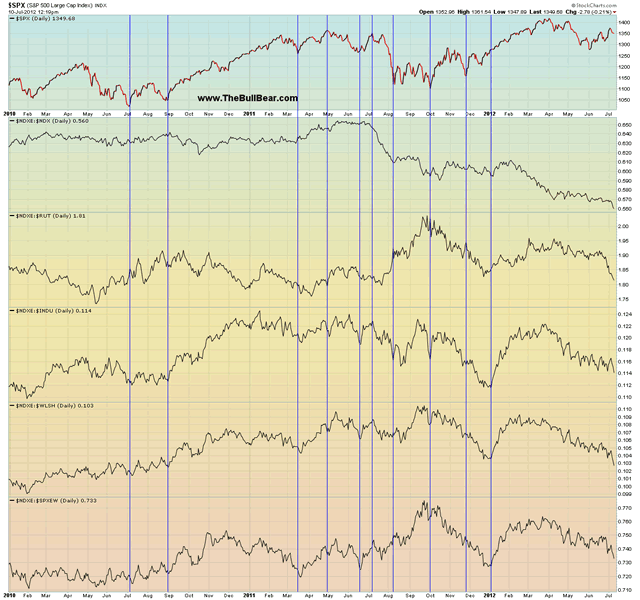
One of the major technical features underlining the bearish potential in this market is the dramatic underperformance of the darling sector, technology. Equal Weighted Tech (NDXE) is getting crushed and semicondictors and networking are leading the way down.
Here's the major index relative performance chart since the April high, with NDXE in blue:
Here are some NDXE ratio charts, which are plunging to new lows:
Here are some more:
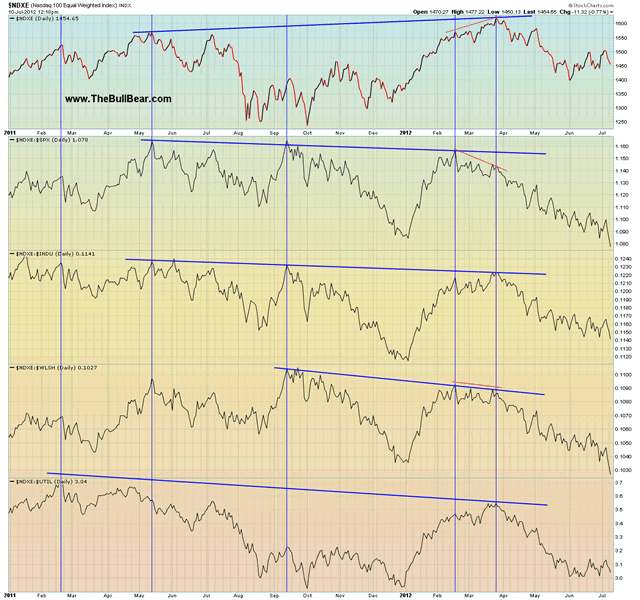
Note that NDXE removes the Apple bias inherent in NDX because of the huge weighting of the stock in the index, so it gives a much truer picture of what is really happening in tech. Year to date, NDXE is vastly underperforming NDX and even underperforming SPX, in spite of the early year run up:
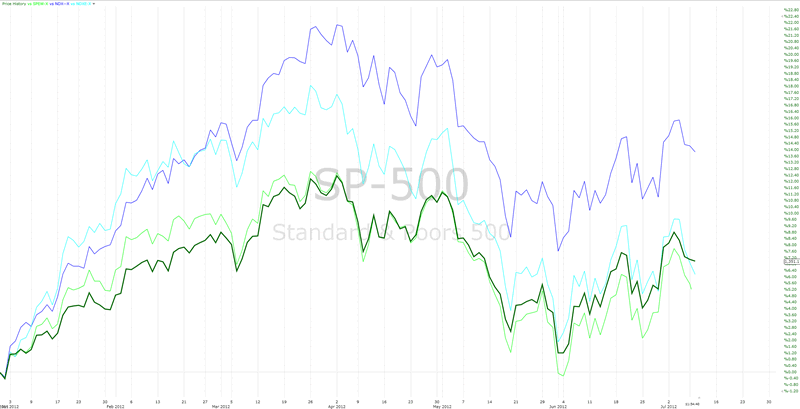
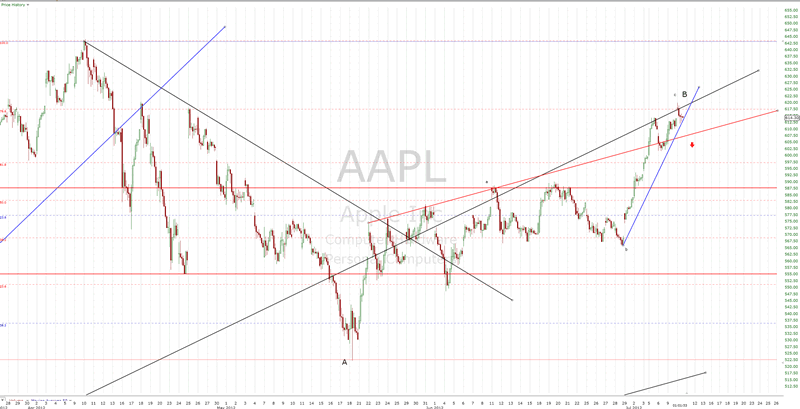
Arguably, Apple made its B wave high today on an intraday pop and drop:
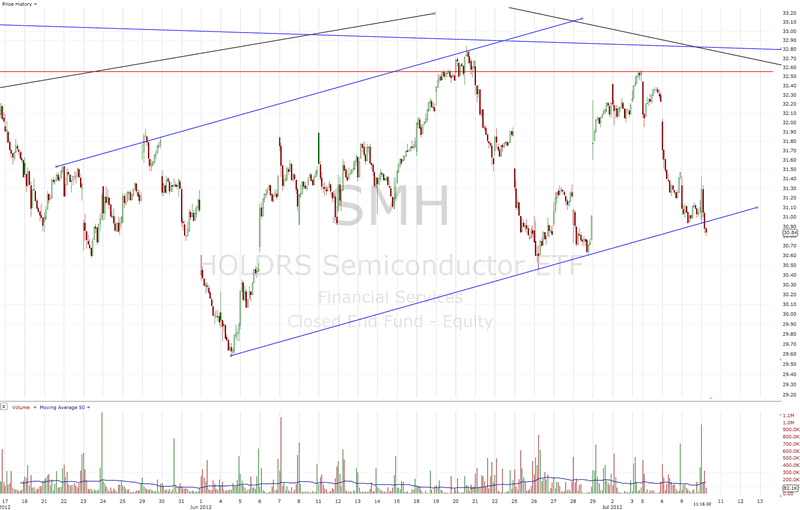
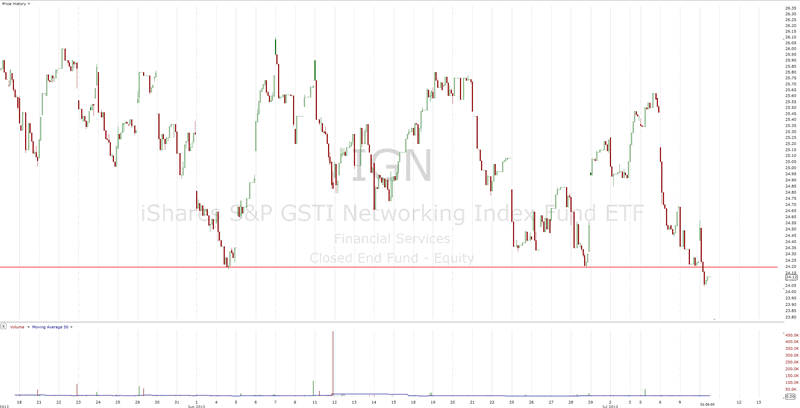
Semiconductors and Networking are breaking down badly:
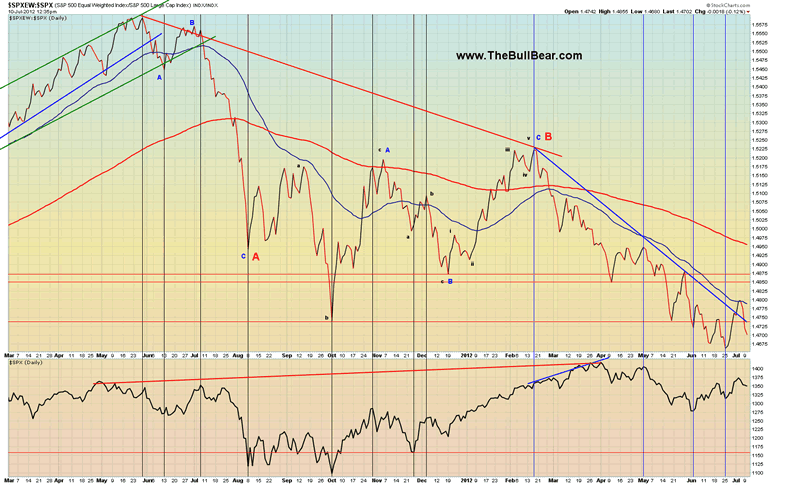
Equal Weighted SPX is starting to underperform SPX and the ratio is almost back to the lows already:
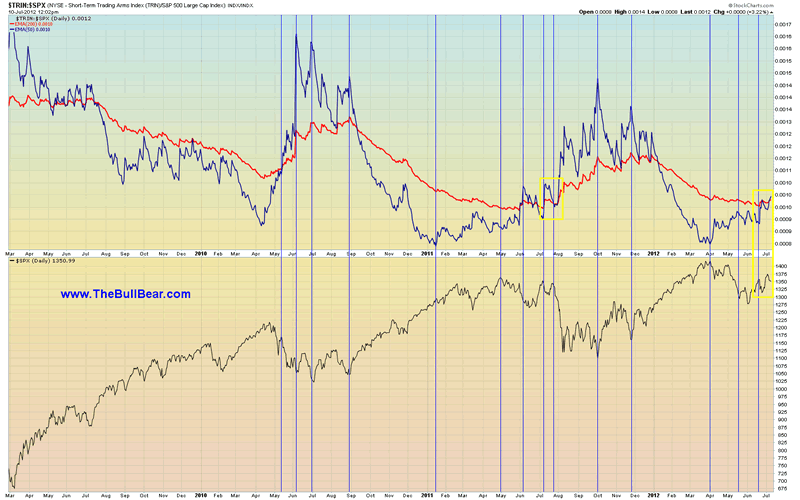
TRIN is signaling a big bearish move soon, as it did a year ago. We have seen a bull cross of 50 Day TRIN:SPX over the 200 Day:
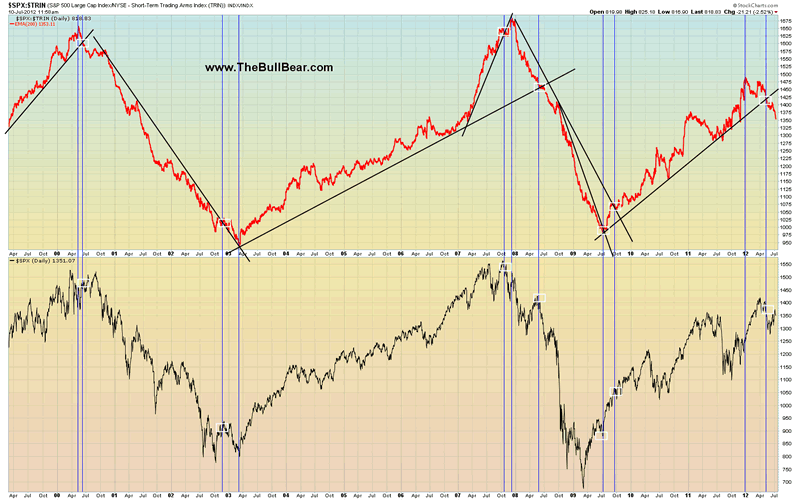
200 Day SPX:TRIN has continued assertively lower:
There are some signs of strength in the technicals, for example, Summation Index has continued higher. So we may yet be in the early stages of a roll over. Remember that in July 2011 there were two highs, and we see that repeat itself.
Over and over again, EuroDollar continues to hit new lows (with analysts actually starting to talk bullishly about it) and there is little if any concern or interest. The assumption is that there is excessive bearishness on the currency and that it will turn around.
Spanish 10 year hit 7% again before rolling over again. It appears to be a test of the recent breakout. A high level consolidation in the area of 7% could be in progress and a strong break and close above that level may be a week or less away:
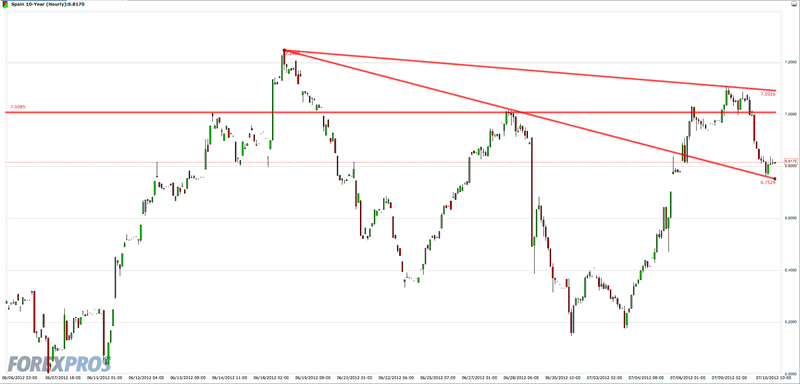
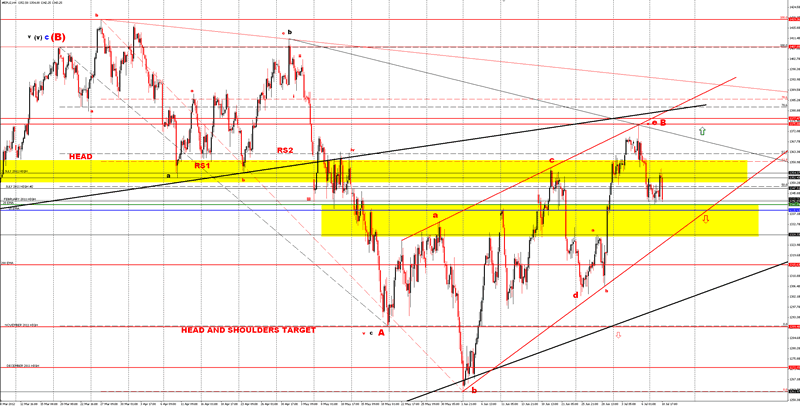
Overall it appears that shorting into this zone is more likely to be rewarded than punished. Traders should give the trade room to breathe up to the recent high. A break below the support of the Feb 2011 high and the 20 and 50 EMAs would confirm our stance and a break above the downtrend indicated by the green up arrow would require caution and may signal a move back to the 2012 high:
Sleepy, careless complacency is nearly universal with few if any market participants on alert for a significant bearish turn. The vibe feels a lot like the early stages of the 2007 top.
Need some help staying on the right side of the markets? Join the BullBear Traders room at TheBullBear.com. You'll get this kind of timely, incisive, unbiased stock and financial market trading, timing, forecasting and investment technical analysis and commentary daily. It's free to join, no credit card is required and if you like my work you just make a donation at the end of each month.

By Steve Vincent
Steven Vincent has been studying and trading the markets since 1998 and is a member of the Market Technicians Association. He is proprietor of BullBear Trading which provides market analysis, timing and guidance to subscribers. He focuses intermediate to long term swing trading. When he is not charting and analyzing the markets he teaches yoga and meditation in Los Angeles.
© 2011 Copyright Steven Vincent - All Rights Reserved Disclaimer: The above is a matter of opinion provided for general information purposes only and is not intended as investment advice. Information and analysis above are derived from sources and utilising methods believed to be reliable, but we cannot accept responsibility for any losses you may incur as a result of this analysis. Individuals should consult with their personal financial advisors.
© 2005-2022 http://www.MarketOracle.co.uk - The Market Oracle is a FREE Daily Financial Markets Analysis & Forecasting online publication.


