Barack Obama's Presidency Economic Report Card – Fail
Economics / US Economy Jul 09, 2012 - 03:02 PM GMTBy: James_Quinn
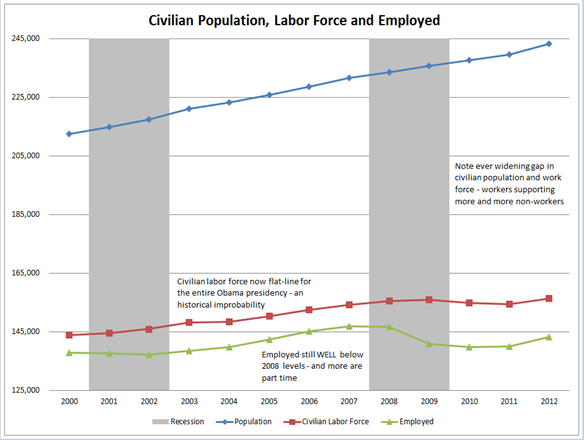
 We are now three and one half years into Barack Obama's presidency. I thought a few pertinent charts would help us assess the success of his economic policies. Upon his election he demanded an $800 billion stimulus package in order to keep the unemployment rate from surpassing 8%. The $800 billion was to be spent over two years we were told and then government spending would be scaled back to pre-stimulus levels. There were 145 million Americans employed when Obama was elected. There are 9 million more working age Americans today than there were in 2008. There are now 142.4 million employed Americans. So, we've added 9 million potential workers and still have 2.6 less Americans employed. We have the same number of Americans employed as we did in early 2006, when there were 17 million less working age Americans.
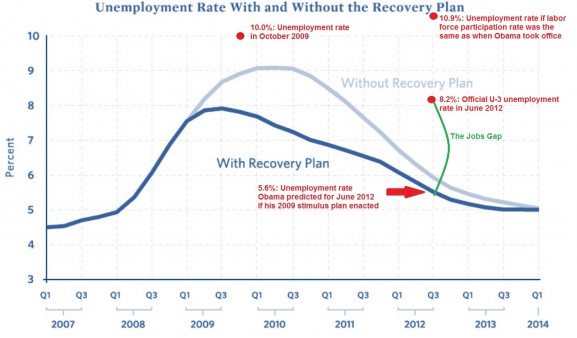
The Obama stimulus plan was passed with everything he wanted. Democrats controlled the House and Senate and gave him exactly what he proposed. By October 2009, the unemployment rate was 10%. Obama's stimulus package and economic policies have been so successful that he has been able to get the unemployment rate all the way down to 8.2% after three and one half years, even though he said his stimulus package would keep the unemployment rate under 8%. And all it took to get the unemployment rate down to 8.2% was for 8 MILLION Americans to leave the labor force. A critical thinking person who doesn't swallow the crap peddled by the BLS and the rest of the government propaganda machine might question WHY 8 million Americans would leave the workforce when people desperately need income. If the labor participation rate had stayed constant, the current unemployment rate is 10.9%.
The long-term chart below tells the true story. The BLS classifying millions as not in the labor force is a crock. The Obama apologists and sycophants peddle a false storyline about Baby Boomers retiring as the cause for this labor force decline. The fact is people over the age of 55 have the highest participation rate in history and it continues to rise. Of the 142.4 million employed Americans, only 114 million works more than 35 hours per week, with 28.4 million working part-time. That means that 20% of those employed are part time workers with no benefits. In 2008, prior to the ascendency of Obama, there were 125 million full-time workers and 20 million part-time workers. Obama has been able to increase the percentage of part-time workers from 14% to 20% in just over 3 years. Remember this fact when Obama touts the 3 million new jobs he's created since 2010.
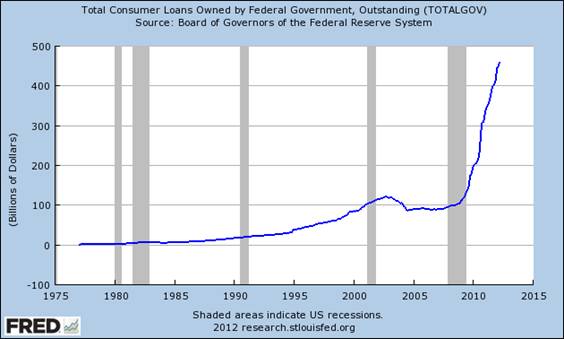
If you were wondering what the 8.5 million Americans who have left the labor force since 2008 were doing, look no further than the millions of bedrooms now functioning as classrooms for the University of Phoenix and the other on-line, for profit diploma mills that have proliferated with the doling out of hundreds of billions in cheap government student loans. These for profit diploma mills know how to game the system and get their money even if the students drop out after a few months. They educate 12% of students, receive 25% of federal student aid and account for nearly 50% of loan defaults. Sounds like a great business model.
Low interest Federal government loans have skyrocketed from $100 billion when Obama took office to $450 billion today. Total student loan debt has surpassed $1 trillion, with the average student graduating with $25,000 of debt and many more burdened with $100,000 or more of debt. Those part-time jobs making lattes at Starbucks aren't cutting it. Default rates are already at a ten year high and are poised to skyrocket as more people graduate into a jobless job market. Not only is the American taxpayer on the hook for the $450 billion of direct Federal student loans, but the Federal government is guaranteeing another $450 billion. When the student loan bubble pops, the taxpayer financed bailout will be epic. And this is all being engineered by the Obama administration in order to artificially reduce the unemployment rate. Does this graph remind you of another bubble that resulted in a few problems for the American taxpayer?
After three and a half years, Obama's policies have led to 11 million less full-time workers and 8 million more part-time workers - just like he drew it up on the board when he committed $800 billion of your tax dollars to saving our economy through classic Keynesianism. Obama declared the stimulus would be a two year jolt to get our economy back on track. Federal government spending was $2.7 trillion in 2006, $2.7 trillion in 2007 and $3.0 trillion in 2008, the last three years of Bush's administration. If spending stayed on a standard trajectory, it would have been $3.1 trillion in 2009, $3.2 trillion in 2010, $3.3 trillion in 2011 and $3.4 trillion in 2012. With the end of the Iraq occupation in 2010, it should have dropped by $200 billion, resulting in total spending of $3.1 trillion in 2011 and $3.2 trillion in 2012.
Obama declared the stimulus would be short-term. Federal government spending should have risen to $3.5 trillion in 2009, $3.6 trillion in 2010 ($300 billion stimulus - $200 billion Iraq withdrawal), and then revert back to $3.1 trillion in 2011 and $3.2 trillion in 2012. Let's see whether Obama was honest in his promises:
Actual Federal Government Spending
2009 - $3.5 trillion
2010 - $3.5 trillion
2011 - $3.6 trillion
2012 - $3.8 trillion
After three and one half years of stimulus spending, Cash for Clunkers, Home Buyer Tax Credits, mortgage modification programs, Fannie, Freddie & FHA accumulating billions in bank losses, zero interest rates, QE1, QE2, Operation Twist, unlimited student loans, wars of choice in the Middle East, mark to fantasy accounting standards for Wall Street, and hundreds of billions in bonuses for criminal bankers, we are left with a $5.3 trillion (50% increase) higher national debt and a $300 billion (2.3% increase) higher real GDP. That's not exactly a big bang for your Keynesian buck. The response you will get from the Obama apologists is, "Imagine how bad it would have been if we didn't spend the money". This is a classic liberal response when their solutions are a total failure. Krugman will declare that if we had only spent another $2 trillion all would be well.
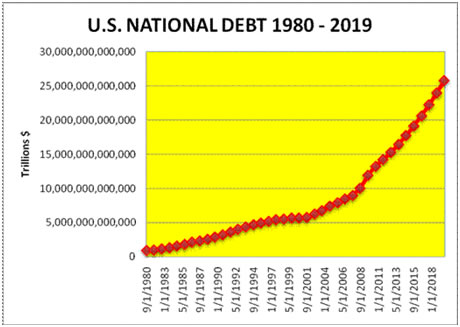
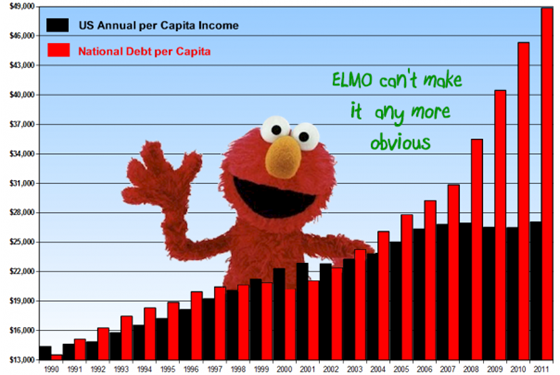
As you can see, Obama and all the politicians in Washington D.C. are really good at spending your money on pork projects, paying off campaign contributors and compensating their corporate cronies. Do you see any reversion back to normalized spending? How can current spending be $300 billion higher than the two stimulus years if Obama was telling the truth in 2009? The Obamanistas declare we are still in an emergency and must borrow and spend to save the economy. The emergency never ends for politicians of both parties. This is how they have bastardized John Maynard Keynes' theory. They love to implement spending when the economy is in the dumper, but they forget his admonition to pay down debt during the good times. It never happens. There will always be another emergency. Even 2nd grade level Sesame Street fans can see the Federal government spending and debt accumulation never reverses. It couldn't be any more obvious, unless you are an intellectually dishonest Keynesian ideologue hack (aka Krugman).
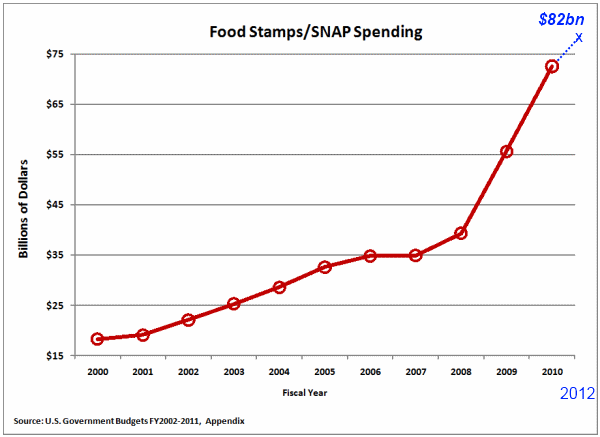
This brings us to the crowning economic achievement of the Obama administration. His most successful program is unequivocally the SNAP food stamp program. When Obama assumed power in January 2009 there were 32 million Americans on food stamps and the annual cost of the program was $44 billion. Today there are 46 million Americans on food stamps and the annual cost is pacing at $75 billion. He has been able to get fully 15% of the U.S. population enrolled in this fantastic program and the Department of Agriculture is even running advertisements to convince more people to join.
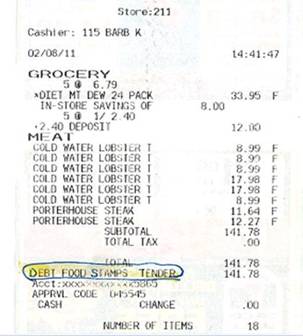
And don't worry about any restrictions. You can buy as much soda, ice cream, cheetos, and fudge brownies with your SNAP card as you choose. Of course, you are still free to purchase higher end fare.
A cynical less trusting soul than me might even conclude that Obama's goal is to provide government entitlements to as many people as possible in order to win votes in the upcoming election. One might ask how he can tout an economic recovery and the millions of "new" jobs he has created since 2010, when 6 million people have been added to the food stamp rolls since his economic recovery officially began in 2010. I'm confused by the Obama distinction between success and utter failure.
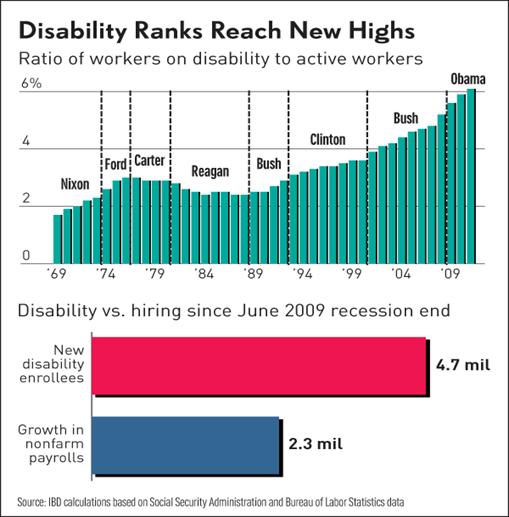
Not far behind the food stamp program, the SSDI program has been another resounding Obama success. He has been able to enroll twice as many participants in this program as jobs created since the end of the recession. There are already 10 million people on SSDI costing the American taxpayer in excess of $150 billion per year. There are 250,000 people per month applying for benefits and the program will be broke by 2015. In a shocking development, when people began to roll off the 99 week unemployment gravy train, the number of new SSDI applications soared. I guess they were depressed at not being able to collect unemployment for two more years.
Bob Adelman recently summed up the SSDI scam:
"The program, funded federally but administered by the states, is being milked by many who have run out of unemployment benefits and other resources and haven’t been able to find work. At present one out of every eight working-age, non-retired individuals receive disability payments, some for “mental disorders” and “back pain.” Claims for mental disorders, for instance, have more than tripled from 10 percent of cases in 1982 to 32.8 percent in 2012, with half of those based on “mood disorders” such as depression or anxiety. Back or neck “problems” have increased by 31 percent and were the top cause of disability for 50- to 64-year olds. Depression and anxiety and other emotional problems increased by 20 percent, and now constitute one-third of all disability claims. Once on the rolls, beneficiaries have little incentive to return to work because their disability entitles them to additional benefits such as food stamps, Medicaid, Section 8 housing, and student-loan forgiveness. As a result less than one half of one percent of those on disability ever go back to work."
I’m depressed by the results of Obama’s economic policies. Maybe I should apply for SSDI.
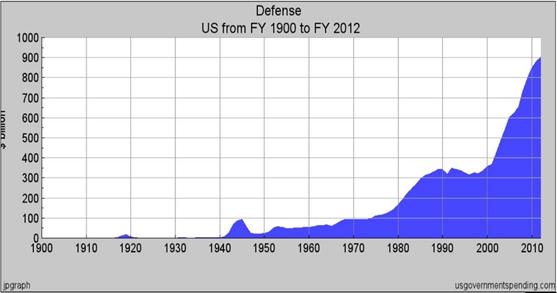
It appears that former college professor Obama never paid attention in his macroeconomics undergraduate course. The “guns versus butter model” doesn't enter the equation for a profound thinker like Barack. Why do hard choices need to be made when Ben Bernanke is manning the printing press? In the real world, a nation has to choose between two options when spending its finite resources. It can buy either guns (invest in defense/military) or butter (invest in production of goods), or a combination of both. This can be seen as an analogy for choices between defense and civilian spending in more complex economies. Politicians and bankers have been ignoring this rational model since 1971 when Nixon closed the gold window. Why make difficult choices when you can borrow and print your way to prosperity? As a country we've chosen guns, butter, BMWs, McMansions, free unfunded healthcare, unfunded pensions, unfunded sickcare, and DHS implemented security for all. In order to prove himself tougher than George W., Obama, the socialist, has actually increased war spending by 23% to an all-time high. Fiat currency is an amazing invention. Guns, butter and healthcare for all.
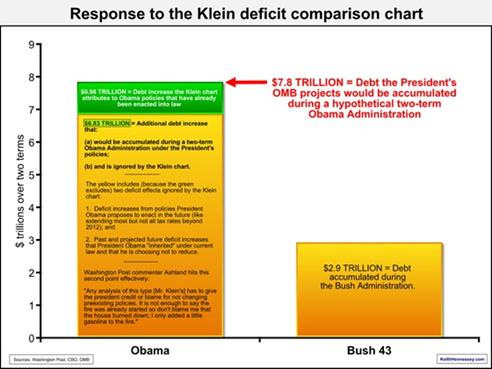
Mainstream media liberals like Ezra Klein dutifully trot out charts and storylines trying to convince the ignorant masses that Obama is not to blame for the soaring national debt. They declare it was the Bush tax cuts and his wars. This blame Bush storyline is growing old as Obama has already extended the Bush tax cuts once, ramped up wars in the Middle East and cut payroll taxes for the last two years. The Office of Management and Budget has calculated the total increase in the national debt will be $7.8 trillion after eight years of Obama, 269% more than was accumulated during the Bush reign of error. I believe the $7.8 trillion is ridiculously optimistic. The national debt has increased by $5.3 trillion since Obama took office. It will go up another $200 billion by the end of this fiscal year. It will surely exceed $1 trillion per year during a 2nd Obama term as he would extend most of the Bush tax cuts, extend the payroll tax cuts, continue to increase war spending, and the hidden delayed Obamacare costs would arrive. His eight year report card will show a $9.5 trillion increase in the national debt, reaching the magic grand total of $20 trillion. The national debt to GDP ratio will be close to 120%.
This scathing assessment of Obama's economic policies is by no means an endorsement of Mitt Romney or his economic plan, since he has never provided a detailed economic plan. After four years of a Romney presidency, the national debt will also be $20 trillion as his war with Iran and handouts to his Wall Street brethren replace Obama's food stamps and entitlement pork. There was only one presidential candidate whose proposals would have placed this country back on a sustainable path. The plutocracy controlled corporate mainstream media did their part in ignoring and then scorning Ron Paul during his truth telling campaign. The plutocracy wants to retain their wealth and power, while the willfully ignorant masses don't want to think. The words of Ron Paul sum up what will occur over the coming years as the interchangeable pieces of this corporate fascist farce drive the country to ruin:
"Deficits mean future tax increases, pure and simple. Deficit spending should be viewed as a tax on future generations, and politicians who create deficits should be exposed as tax hikers."
"A system of capitalism presumes sound money, not fiat money manipulated by a central bank. Capitalism cherishes voluntary contracts and interest rates that are determined by savings, not credit creation by a central bank."
"Believe me, the next step is a currency crisis because there will be a rejection of the dollar, the rejection of the dollar is a big, big event, and then your personal liberties are going to be severely threatened."

The politicians, bankers, corporate titans running this country are too corrupt and cowardly to reverse the course on our path to destruction. The debt will continue to accumulate until our Minsky Moment. At that point the U.S. dollar will be rejected and chaos will reign. The Great American Empire will be no more. At that time sides will need to be chosen and blood will begin to spill. Decades of bad decisions, corruption, cowardice, ignorance, greed and sloth will come to a head. The verdict of history will not be kind to the once great American Empire.
Join me at www.TheBurningPlatform.com to discuss truth and the future of our country.
By James Quinn
James Quinn is a senior director of strategic planning for a major university. James has held financial positions with a retailer, homebuilder and university in his 22-year career. Those positions included treasurer, controller, and head of strategic planning. He is married with three boys and is writing these articles because he cares about their future. He earned a BS in accounting from Drexel University and an MBA from Villanova University. He is a certified public accountant and a certified cash manager.
These articles reflect the personal views of James Quinn. They do not necessarily represent the views of his employer, and are not sponsored or endorsed by his employer.
© 2012 Copyright James Quinn - All Rights Reserved
Disclaimer: The above is a matter of opinion provided for general information purposes only and is not intended as investment advice. Information and analysis above are derived from sources and utilising methods believed to be reliable, but we cannot accept responsibility for any losses you may incur as a result of this analysis. Individuals should consult with their personal financial advisors.
James Quinn Archive |
© 2005-2022 http://www.MarketOracle.co.uk - The Market Oracle is a FREE Daily Financial Markets Analysis & Forecasting online publication.


