DJIA Leads Stock Market Rally Higher
Stock-Markets / Stock Markets 2012 Jun 18, 2012 - 04:41 AM GMTBy: Andre_Gratian
 Current Position of the Market
SPX: Very Long-term trend - The very-long-term cycles are down and, if they make their lows when expected (after this bull market is over) there will be another steep and prolonged decline into late 2014. It is probable, however, that the steep correction of 2007-2009 will have curtailed the full downward pressure potential of the 120-yr cycle.
SPX: Intermediate trend - SPX is probably putting the finishing touches on an intermediate-term bottom.
Analysis of the short-term trend is done on a daily basis with the help of hourly charts. It is an important adjunct to the analysis of daily and weekly charts which discusses the course of longer market trends.
Market Overview
In the last newsletter, I wrote the following:
"There are three potential projections. The most conservative is 1333. The next, which is moderate, is 1343. And there is an optimistic target of 1353. Since all of them exceed the high of 1329 which has already been reached, the odds favor a move past that level with the SPX deciding which target it wants to honor."
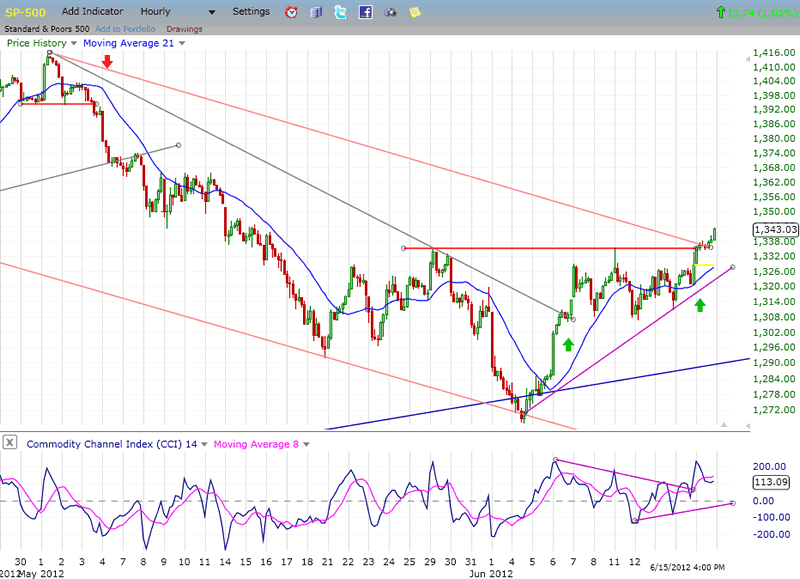
After reaching its conservative projection of 1333, SPX consolidated for a brief period and resumed its uptrend last Thursday. By Friday's close, it had met its moderate projection of 1343 and, in the process closed slightly outside of its correction channel and triggered a buy signal in the daily momentum indicators. The break-out move was fueled by expectations that this week-end's Greek elections would bring positive results and that central banks were ready to act to assist a weakening Eurozone economy.
Whether the SPX pushes immediately toward its next target of 1353 or consolidates first should be known by Monday's opening. It is normal for some profit-taking to occur after a projection is reached. This is what happened after we met the first target of 1333, and it may take place again at 1343 before moving higher. 1343 also represents a 50% retracement of the correction which started at 1422. Even if another consolidation does occur at this level, the increased momentum of the daily indicators suggests that the most liberal target has a good chance of being filled. And then what?
That will depend on whether the 2-yr cycle bottomed on 6/04, or whether its low is still ahead. If it has already made its low, it would be on the earliest date since 1992. Normally, the bottom occurs in the month of July, and it has occasionally extended into August. That, and the fact that we should get a decent pull-back after reaching 1343 or 1353 enhances the odds that its low will occur over the next 2 or 3 weeks.
Although the DOW and the SPX have shown good upside momentum over the past two days, this enthusiasm has not been shared by a number of other indices that I use as leading and confirming indicators. The most obvious of these is the Russell 2000 which is still trading below its 200-DMA and within its correction channel. Another is TLT which is still showing good strength and even went up on Friday instead of down. But the most important index which is flashing dissenting signals is VIX. In order to confirm the break-out by DJIA and SPX, it should have traded below 20 on Friday. Instead, its intraday low was only 20.61, and it closed at 21.11. In my view, this constitutes a non-confirmation of the move by the two bullish indices, and it requires some caution going into Monday. Perhaps it's only a delayed reaction by the VIX and the other laggards, but it's a warning that we should wait for a concerted confirmation that we have, indeed, made an intermediate low.
Chart analysis
Instead of starting with the SPX, let's compare the Dow Jones industrials to the transportation index (Charts courtesy of QCharts). There is no question that the Industrials are stronger. The DJIA made a new high on 5/01 while the Transportation index did not. That constituted a double non-confirmation according to the Dow Theory. Not only did the Tran fail to make an intermediate new high along with the DJIA, it also failed to make a new bull-market high along with the Industrials on 4/02. That, in itself, is a potential red flag for the long-term.
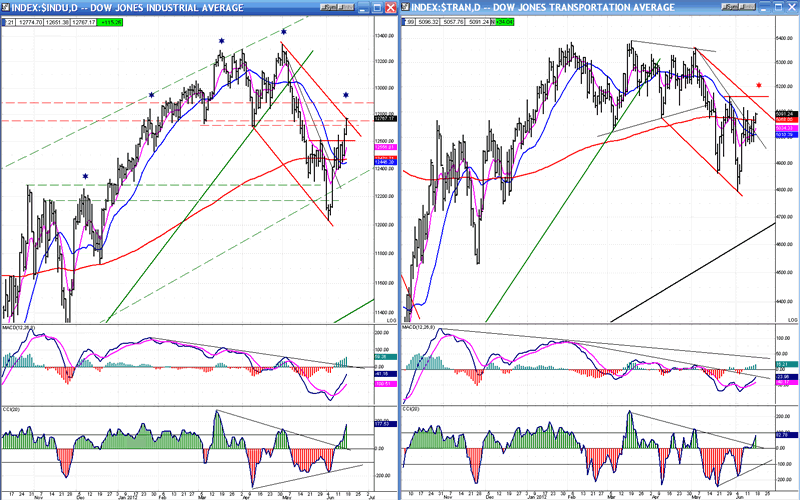
But what about now? Same situation! The DJIA is stronger over the near-term and the Tran is not confirming this strength. I don't know if the Dow Theory extends to short-term trends, but even if it does not, this is one more index which is not confirming the "break-out". It is perhaps worth noting that the Dow Composite and Financial indices are both very similar to the Industrials.
As for the DJIA, Friday's strength did not put it outside of its corrective channel, but it did bring it to the lower level of the overhead resistance which extends to the former high. Two other matters of interest: the first is the fact that the MACD (which did NOT show positive divergence at the low) is still negative and will soon reach the zero line. After becoming very oversold, there is a tendency for this index to consolidate around the zero line before it goes positive. The other is that it has reached -- or is about to reach - the time frame designated by the dark blue asterisk which marks the end-phase of a 7-week cycle which has recently been very consistent at indicating a short-term high.
Let's move on to the Hourly SPX chart which shows clearly the attempt at breaking out by going past the former highs and the channel line. Did we just break a neckline? We can't ignore the potential inverse Head & Shoulders which has formed, but we also know that many of these patterns morph into something else, so we'll need some confirmation that the SPX is making this bullish pattern.
There is not much more to see on this chart, except that the index may have completed 5 minor waves from Thursday's low and may be ready to retrace. This would be substantiated by the fact that the index is clearly diverging on that fifth little wave. That divergence is even more apparent in the A/D oscillator (not shown here). This matter should be resolved on Monday by either following through on the upside, or backing off immediately.
Cycles
The ambivalence about the mid-June cycles is no longer an issue. They should bring about a high and not a low.
The 2-yr cycle is still definitely an issue, but it should be resolved shortly, possibly by Wednesday, depending on the statement that will be made by the FOMC.
Beyond that, the same 7-wk cycle could bring about another top in the first week of August, unless it is overridden by the 22-wk and the 36-wk cycles which are scheduled at the same time and which could turn that time frame into a low.
Breadth
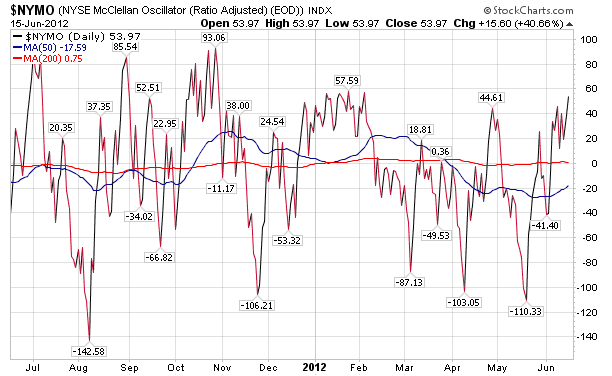
The NYMO and NYSI (courtesy of StockCharts.com) are shown below. After a short consolidation, the NYMO made a new high along with the SPX on Friday. There is no divergence, but it is a fifth wave from the low, and this could cause it to retrace.
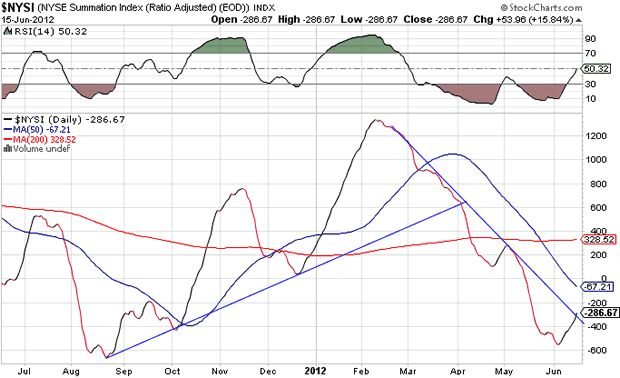
The continued strength in the above indicator has helped the NYSI to continue rising and it is now challenging its down-trend line. The RSI has reached the 50% line and may need to consolidate for a while before moving higher, in the same way that it did in September 2011.
Sentiment Indicators
The VIX
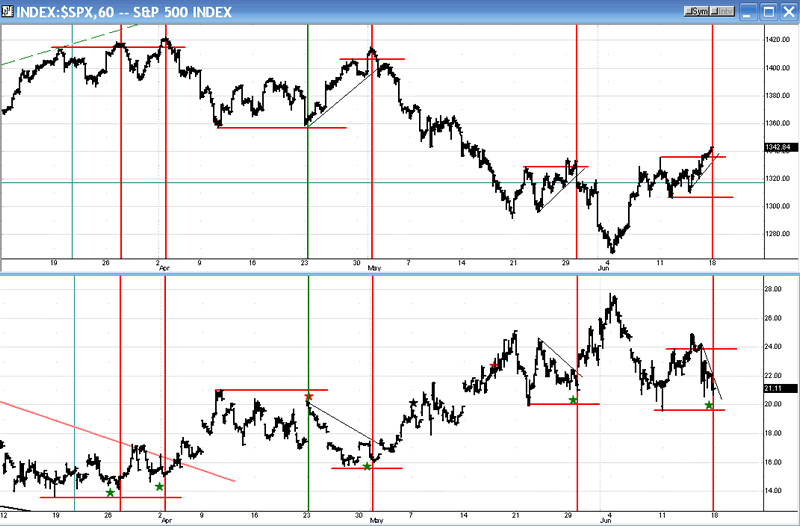
This is a 60-m chart of the SPX (top) vs. VIX (bottom). I have marked where the divergence between the two indices resulted in a trend change. The red vertical lines indicate a top in the SPX and the green line, a low. We are at a point when divergence between the two indices suggests that a top may be forming in the SPX. If you add this warning to the reaching of the 1343 target, and the non-confirmation by the other indices mentioned earlier, you have what constitutes a potential red flag at this juncture.
XLF (Financial SPDR)
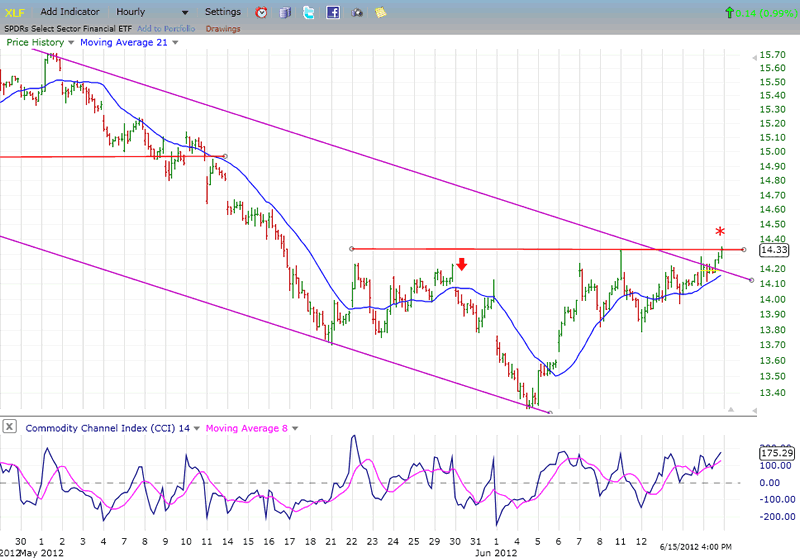
Normally, this is an index which also shows divergence with the SPX when the latter is close to a reversal. It's a moot point whether divergence can be seen to exist at the place which is marked by a red asterisk. By Friday's close, the only high which remained standing was the top of the first phase from the 6/04 low. By itself, it would probably not mean much, but reinforced by what VIX and TLT are showing, it could be meaningful. Let's wait until Monday to see if it has negative implications for the way the market opens.
BONDS
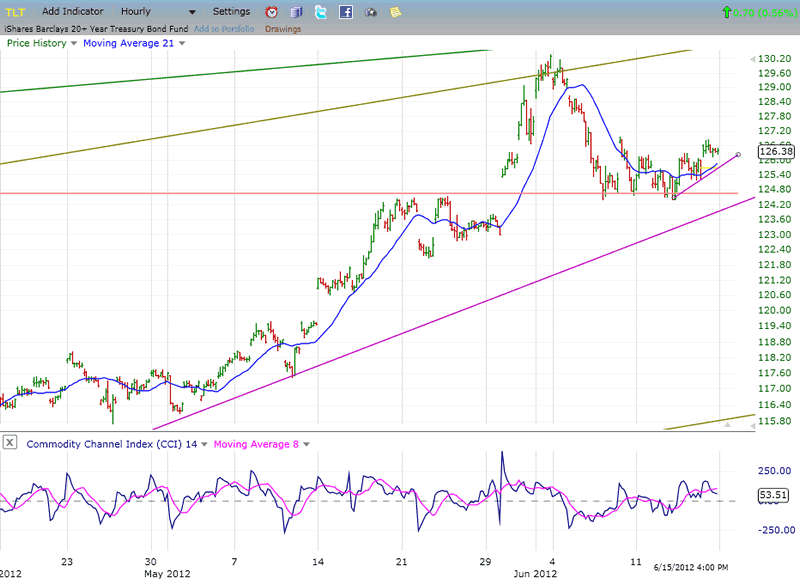
TLT has the same potential H&S pattern which is found in a reverse manner in the other indices. But it also showed a lack of conformity with SPX on Thursday and Friday. While the former was going up in the past two days, TLT should have been going down and, clearly, it did not. Can so many signals developing in various indicators be false? We'll see on Monday!
UUP (Dollar ETF) Daily Chart
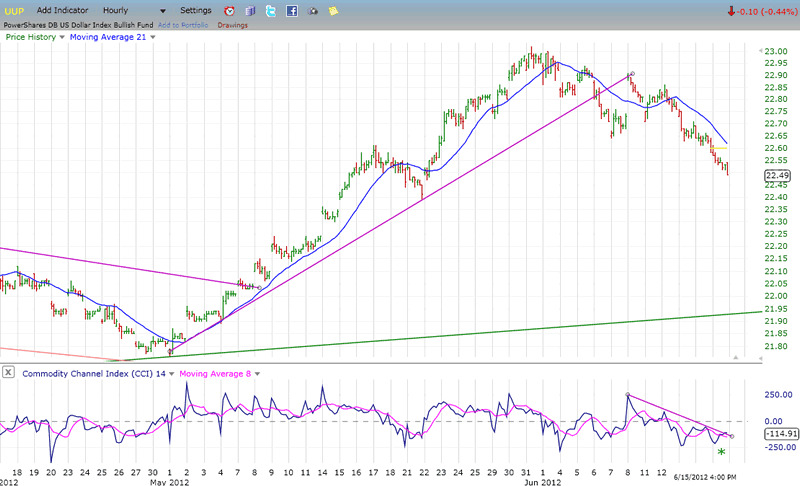
By contrast, and by its concerted decline, UUP is fully confirming the rise in the equity markets - well, some, anyway! So, is this index throwing a wrench into the works of those which are giving us a different picture? Perhaps not! If you look at the indicator, you will see that it has formed some positive divergence to the price over the past two days, and that it is threatening to break its downtrend line. That may be enough to put UUP on the same wave length as the others which are looking for a reversal in SPX.
GLD (ETF for gold)
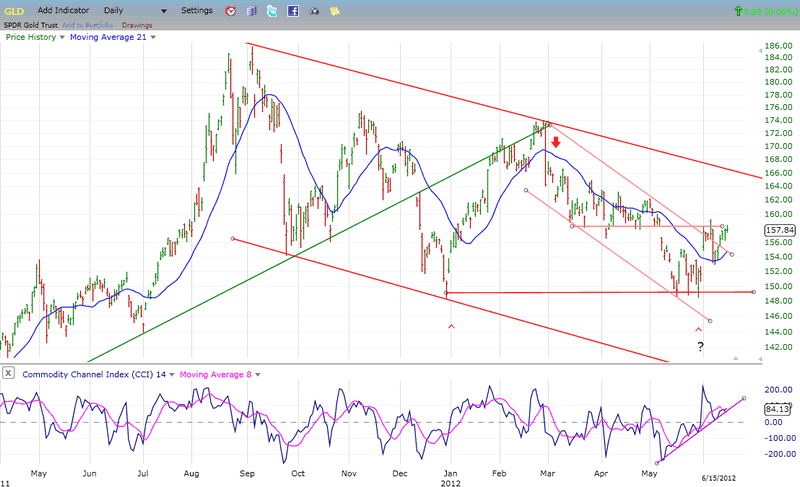
GLD has been in an intermediate consolidation pattern ever since it reached its 185 (interim?) long-term projection in early September, 2011. It has now made a double-bottom at the 149 level, and started a short-term uptrend which, according to the Point & Figure chart, could take it to 162. It has already broken out of a short-term channel, but is still a long way from doing the same with its intermediate channel. At this time, it would have to go to at least 164 to challenge the top channel line.
Whether it can do that or not will depend, in part, on whether or not the 25-26 week cycle has already made its low. If it has, it would put it in the same predicament as the 2-year cycle which may have made an early low. In the past, after the gold cycle has bottomed, the price starts to move up decisively, making it clear that a low had occurred. The last two lows are a good example of this action. So far, the current pattern does not have that characteristic and leaves us in doubt as to whether or not the low has been made.
The indicator has come from an oversold position and spiked into positive territory. Now, however, it looks as if negative divergence is forming and it is questionable if GLD can overcome the overhead resistance which has just capped its initial rally. More time is needed to determine if the index is in a position to resume its long-term uptrend. In the meantime, should it break the 149 support, it could quickly fill its long-standing projection target of 141.
OIL (USO)
In the last newsletter, I had a long discussion about USO's future prospects, which don't seem to be very bright:
"From its high of 119 in June of 2008, the stock dropped straight down to 23 in February 2009 and has gone essentially sideways since. The highest retracement it has been able to achieve was when it rallied to 45 in April of last year. That represented a rebound of exactly 23.6% of its total drop.
USO is very likely to break its 23 low and eventually end up somewhere around 8. But this projection, if correct, will only be reached in the Fall of 2014 when the next bear market comes to an end."
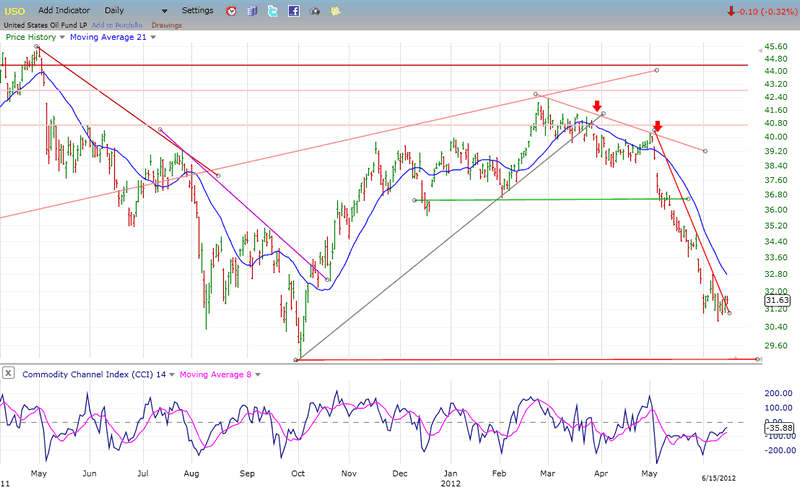
For now, USO has reached a short-term projection and is beginning to consolidate. The sharp decline that it has just completed has all the appearances of being a wave 3 from the 42.30 high. If so, it would mean that it is now starting wave 4 and, therefore, expected to rally for a while. When 4 is complete, wave 5 would probably take it down to its long-term support of 29.10. However, as stated above, it is not likely that this would be the end of the decline. It looks to me as if USO has much more ground to cover on the downside over the next couple of years.
Summary
This was stated in the last Summary:
"The SPX may be ready to extend its near-term correction before moving higher and completing its rally from 1267. The top is expected to be around 1343 and come in mid-June. After that, an additional decline should take hold which could lead to a marginal new low."
What was written in the first two sentences has come to pass, but the next prediction may not be realized literally. First, it is very possible that the rally will be extended to 1353 before it peters out. Next, it does not seem likely that any pull-back will cause the SPX to make a new low.
As I have written above, there are many signs that the enthusiasm displayed by the DJIA and the SPX is not shared by other important segments of the market. And, since the result of the Greek elections will have an immediate effect on whether the rally is extended to the higher projection, or if we begin to pull back immediately, I will wait until tomorrow to extend my forecast.
FREE TRIAL SUBSCRIPTON
If precision in market timing for all time framesis something that you find important, you should
Consider taking a trial subscription to my service. It is free, and you will have four weeks to evaluate its worth. It embodies many years of research with the eventual goal of understanding as perfectly as possible how the market functions. I believe that I have achieved this goal.
For a FREE 4-week trial, Send an email to: ajg@cybertrails.com
For further subscription options, payment plans, and for important general information, I encourage
you to visit my website at www.marketurningpoints.com. It contains summaries of my background, my
investment and trading strategies, and my unique method of intra-day communication with
subscribers. I have also started an archive of former newsletters so that you can not only evaluate past performance, but also be aware of the increasing accuracy of forecasts.
Disclaimer - The above comments about the financial markets are based purely on what I consider to be sound technical analysis principles uncompromised by fundamental considerations. They represent my own opinion and are not meant to be construed as trading or investment advice, but are offered as an analytical point of view which might be of interest to those who follow stock market cycles and technical analysis.
Andre Gratian Archive |
© 2005-2022 http://www.MarketOracle.co.uk - The Market Oracle is a FREE Daily Financial Markets Analysis & Forecasting online publication.


