


Questioning The Global Stock Market Growth Metric
Stock-Markets / Global Stock Markets Jan 28, 2008 - 04:02 PM GMTBy: Captain_Hook
 Previously, tactics employed yesterday by price managers to squeeze stocks higher worked well on a prolonged basis, but because bearish traders are not willing to fall for this anymore means rallies are fleeting. (More on this below.) And Da Boyz used up quite a few cards yesterday for a meager 10-point gain in the S&P 500 (SPX), with the most notables in addition to the Bernanke promise of lower rates (meaning it's now discounted in the market) being the rumor Bank Of America is buying Countrywide Financial (meaning this too is now discounted in the market), along with American Airlines raising the pot by opening merger talks. Of course, neither of these sound bites will do anything to help an increasingly stressed consumer, the larger credit crunch, nor increasing cases of insolvency in the end.
The following is a commentary that originally appeared at Treasure Chests for the benefit of subscribers on Friday, January 11th , 2008.
The fact stocks came well off their highs in spite of these efforts isn't phasing the bulls however, where as mentioned above put / call ratios continue to fall, meaning the bulls are aggressively buying the perceived oversold condition in the stock market. This is of course the ultimate contrary indicator with respect to sentiment as it pertains to affecting trade in the stock market, and not just the meaningless opinion market surveys reflect. The fact this is happening has technicians watching Wednesday's lows, meaning if exceeded expect intensified (stop-loss related) selling. This could happen as early as today with the stock market in ‘crash mode', where once these lows are taken out the bulls could begin to unload as well.
Most are having trouble putting two and two together in terms of what is happening here because the stock market is falling so fast. The fact of the matter is most traders that are still solvent are the perma-bulls who have been rewarded by the short squeeze since the 2003 lows. As you may know from previous discussions on the subject, this is a phenomenon sponsored by both bearish speculators and hedgers placing insurance on leveraged portfolios via derivatives related schemes sold by banks and brokers. With losses for hedge funds adding up daily however, increasing numbers are getting knocked out of the game, so the need to buy puts to insure leveraged portfolios is fading fast, meaning price mangers are lacking fuel to squeeze prices higher. Thus, it appears the mechanism that drove stocks higher since 2003 has reversed then, and as leverage is unwound, even though losses for US stocks are already the worst in history to start a year, they could get worse.
In this respect I will refer to observations made Monday (See Figure 3 ) and Wednesday in attempting to identify the nature of what is occurring here, along with both reaffirming targeting metrics as well as introducing some new ones. Concerning Monday's observation comparing the current decline in the NASDAQ to that of the Dow post the 1937 echo-bubble top, it appears we may be gripped in a calendar day scenario as opposed to the possible trading day outcome discussed earlier in the week after all if stocks continue falling to a significant degree, which again could be the case if Wednesday's lows are taken out in the near future. Here is a look at the appropriate chart. (See Figure 1)
Figure 1
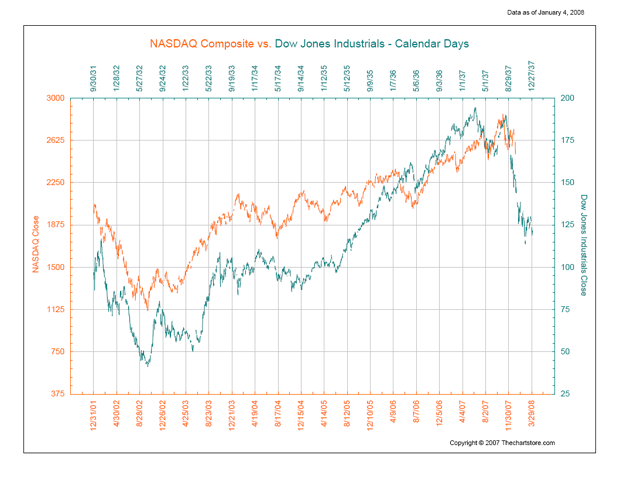
Source: The Chart Store
As you can see above, and in spite of the fact losses this year are already the worst in history, which as mentioned above is keeping bears on the sidelines (and put / call ratios declining), if we are about to repeat the post '37 echo-bubble top experience, then stocks could continue to plunge, potentially into the March timeframe discussed Wednesday in relation to an anticipated Martin Armstrong Pi Cycle low. One should note the convergence of the two strikingly profound historic patterns (one cyclical and the other not) with respect to a March low, which of course increases the integrity of this observation set considerably. What's more, it should be noted that in addition to the diamond related target of 1175 for the SPX discussed the other day, if the decline in the NASDAQ is as severe as that experienced in the Dow back in the 30's (41%), it would almost be cut in half, meaning a commensurate decline in the broad market would be much worse than vertical counts currently suggest. In fact, such a development would mean a fall back to the 2002 lows is possible. Impossible? Crazy? Don't kill the messenger.
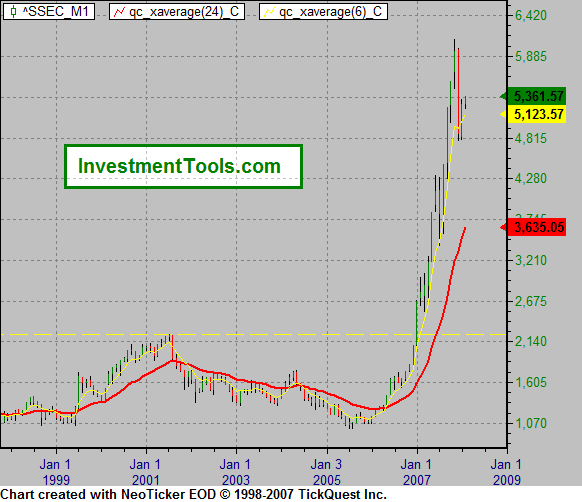
Further to this, and an important topic (and possible opportunity) because this area of investment has been one of the primary beneficiaries of much of the leverage discussed above over the past few years, Chinese stocks (and India ) are thought to be in a bubble, and poised on a precarious perch. And in fact when you examine the situation, one finds this does appear to be the case. This condition is perhaps best identified through a series of plots provided by InvestmentTools.com , with the first here showing the rapid inflation of a bubble in the China Shanghai Composite Index (SSEC) over the past few years. (See Figure 2)
Figure 2
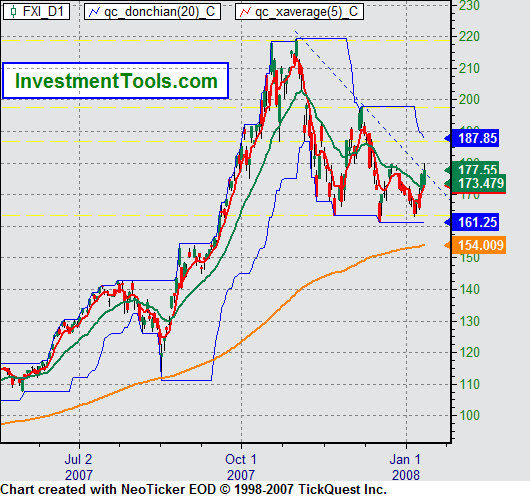
What's more, investors are still very positive with respect to prospects for China, as can be seen in trade of the iShares FTSE / Xinhua China 25 (FXI) Exchange Traded Fund (ETF) , which is just testing the 50-day MA on the daily plot, with those not attuned to such dimensions attempting to break the trade out of what appears to be a descending and contracting triangle . Of course anybody who has studied rudimentary technical analysis would know such triangles are indicative of a market losing energy most of the time, which I believe to be the case this time around, meaning it should break to the downside soon. (See Figure 3)
Figure 3
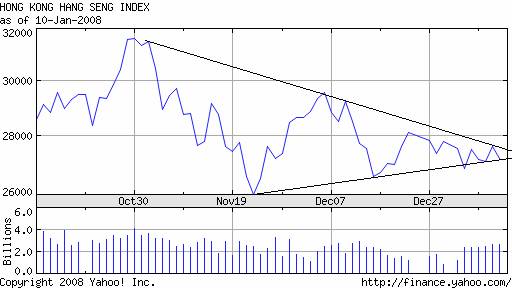
And in fact this break might occur very soon, with a divergence between the FXI and the Hang Seng (normally tightly correlated) developing over the past few days indicating investor sentiment is far too optimistic with respect to prospects in China . Here is a short duration snapshot of the Hang Seng showing it closed the week on triangle support, while the FXI closed yesterday at the top of a triangle. (See Figure 4)
Figure 4
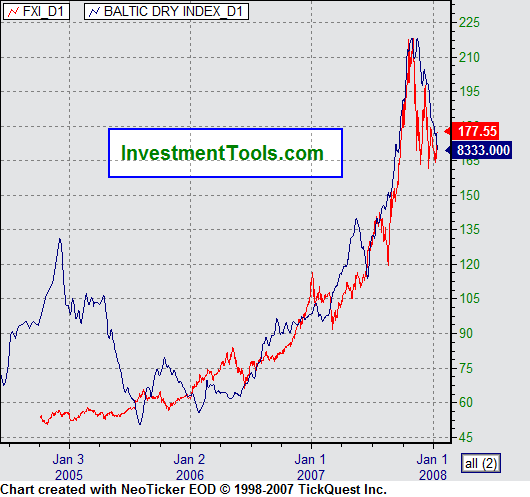
Augmenting the view this divergence is not a completely sentiment related phenomenon is the fact a very tight correlation between Chinese stocks and the Baltic Dry Index (BDI) exists, implying as long as shippers are able to demand high rates the global economy is strong, and these stocks should remain firm because demand for exports is thought to be good. Of course it's the old ‘chicken / egg argument' here, where it should be noted the FXI is leading the BDI down, as can be seen below. In this respect it could be argued shipping rates remain high due to stubborn crude prices, not a strong consumer. Here, if the consumer is so strong, then why do recently released statistics in the US show overdue credit card payments over 60-days being up 30-percent year-over-year, with the trend rising sharply. And there is a great deal evidence now emerging that shows the credit contagion is spreading further than credit cards now, moving like wildfire into all sectors / locales of the global economy. (See Figure 5)
Figure 5
So, if the FXI were to break lower in coming days, a very large void in the inflationist belief system will become evident, and not only will the BDI follow the FXI lower, but as per our observations above, the NDX (and broad / global indices) might get whacked far harder than most bears are currently contemplating. Again, this is part of that mechanism discussed above that is keeping put / call ratios falling.
What about short ratios – why are they not falling? Answer: In part it's because investors are shorting ETF's that short the stock market so much these days (because they are bullish and think they are clever in doing so – like a fad) short selling statistics are buoyed by this situation, which of course is painting an inappropriate sentiment picture in a broader context. Put that one in your pipe and puff on it a while.
And as alluded to above, this kind of thing doesn't stop there, where with respect to sentiment on Chinese stocks, not only are they trading divergent to the larger equity complex and remaining stubbornly strong (like the NASDAQ in 2000), they are in fact at a relative premium extreme to the Dow, which is still considered the safest stock market in the world. Measured via the ratio between the ProShares UltraShort FTSE / Xinhua China 25 (FXP) / ProShares UltraShort Dow 30 (DXD) Ratio shown below, what should be surprising to you is it's trading at the bottom of its range with most measures of stocks essentially at the lows, meaning relatively risky Chinese stocks are at the top of their premium measure against the blue chips when it should be the other way around. (See Figure 6)
Figure 6
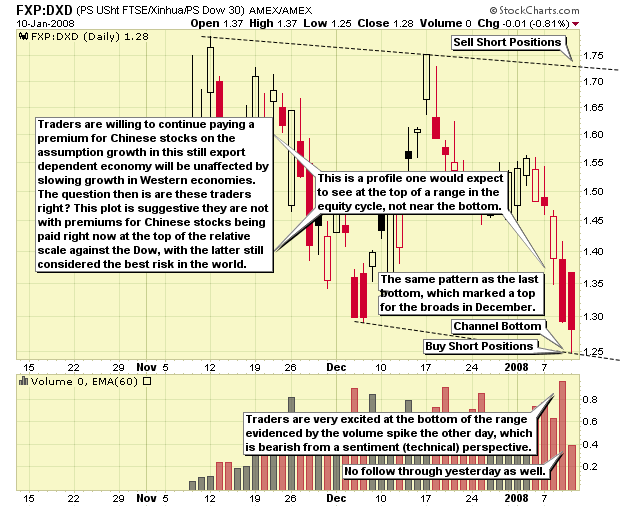
Again, this is one of those items you should pack very tightly down into your pipe, light gingerly, and puff on slowly when considering just how bad things could go for stocks. Of course stocks will not go straight down, as at times put / call ratios will rise for various reasons. And as alluded to in this observation, make no mistake about it, this measure of sentiment is key in determining how investors will react to the news of the day. This is of course why US stock market futures are under pressure this morning, because the break below 1.55 on the SPX US index options series discussed Wednesday has occurred with the moniker attempt to initiate a short squeeze in stocks by price managers yesterday. All they accomplished was to squeeze out even more shorts, and have now set the stage for a panic to develop once Wednesday's lows are violated.
So, when does one cover his / her short positions / hedges? Certainly we already have what look to be reliable / reasonable metrics provided above – those being the 1175 level on the SPX along with the channel top in the FXP / DXD Ratio. These should work well if they converge with what appears to be a good set-up for lows in March characterized by rising open interest put / call ratios into series months covering the summer. We will be watching for this at the time.
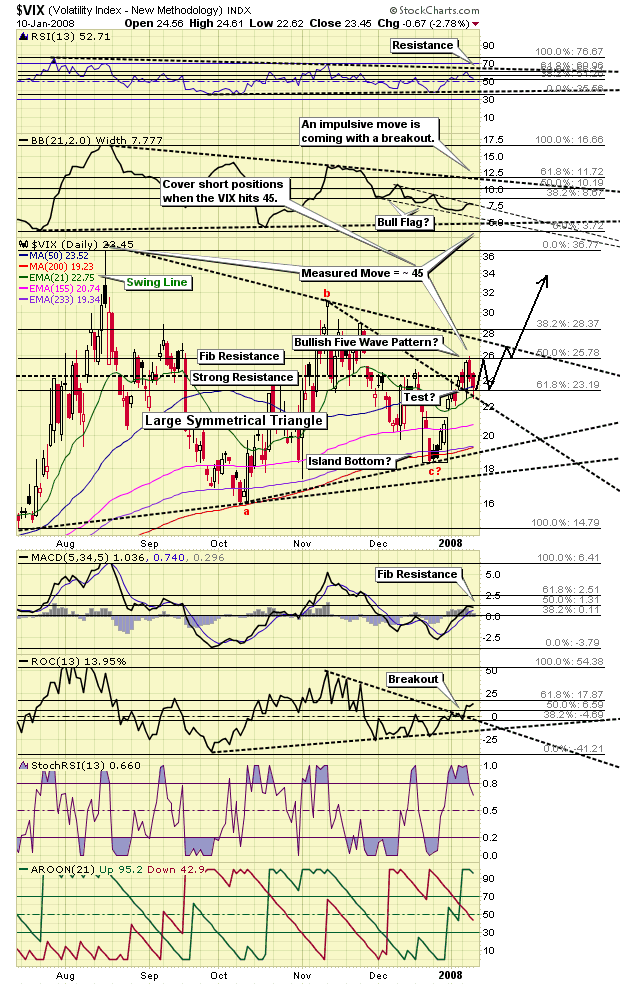
In addition to these metrics, we would also watch for a 45 print on the CBOE Chicago Volatility Index (VIX) to aid in confirming a bottom, which just so happens to be the measured move off the apparent triangular prices are just testing right now, as seen below. Here then, we have another potentially reliable target to shoot for in looking for a bounce in stocks, whenever this should occur. And who knows, maybe 45 is hit by Tuesday on its way to 150 (the 1987 crash extreme) by March. Such an outcome would correspond to the scenario suggested in Figure 1 transpiring. (See Figure 7)
Figure 7
That's all for today folks.
Good investing all.
By Captain Hook
http://www.treasurechestsinfo.com/
Treasure Chests is a market timing service specializing in value-based position trading in the precious metals and equity markets with an orientation geared to identifying intermediate-term swing trading opportunities. Specific opportunities are identified utilizing a combination of fundamental, technical, and inter-market analysis. This style of investing has proven very successful for wealthy and sophisticated investors, as it reduces risk and enhances returns when the methodology is applied effectively. Those interested in discovering more about how the strategies described above can enhance your wealth should visit our web site at Treasure Chests
Disclaimer: The above is a matter of opinion and is not intended as investment advice. Information and analysis above are derived from sources and utilizing methods believed reliable, but we cannot accept responsibility for any trading losses you may incur as a result of this analysis. Comments within the text should not be construed as specific recommendations to buy or sell securities. Individuals should consult with their broker and personal financial advisors before engaging in any trading activities, as we are not registered brokers or advisors. Certain statements included herein may constitute "forward-looking statements" with the meaning of certain securities legislative measures. Such forward-looking statements involve known and unknown risks, uncertainties and other factors that may cause the actual results, performance or achievements of the above mentioned companies, and / or industry results, to be materially different from any future results, performance or achievements expressed or implied by such forward-looking statements. Do your own due diligence.
Copyright © 2008 treasurechests.info Inc. All rights reserved.
Unless otherwise indicated, all materials on these pages are copyrighted by treasurechests.info Inc. No part of these pages, either text or image may be used for any purpose other than personal use. Therefore, reproduction, modification, storage in a retrieval system or retransmission, in any form or by any means, electronic, mechanical or otherwise, for reasons other than personal use, is strictly prohibited without prior written permission.
Captain Hook Archive |
© 2005-2022 http://www.MarketOracle.co.uk - The Market Oracle is a FREE Daily Financial Markets Analysis & Forecasting online publication.