


Stock Market Update: The French 'Rogue Trader' Connection
Stock-Markets / US Stock Markets Jan 27, 2008 - 12:57 AM GMTBy: Dominick
 You may recall in November and December I mentioned patterns that called for a Santa Claus rally extending into the first several months of '08. Now that we know of the colossal fraud at France 's second largest bank, I believe we probably would have seen that rally unfold if not for the liquidation of the massive Societie Generale long positions. As you know, the selling climaxed in the huge holiday selloff early this week and fostered lingering insecurity even after the emergency rate cut until we finally learned Wednesday who killed our rally: the French did it!!
<BE AWARE THIS IS THE FINAL WEEK TO JOIN TTC AT$89, BEFORE PRICES INCREASE TO $129, AND TO BE GRANDFATHERED IN AS A RETAIL INVESTOR BEFORE WE CLOSE OUR DOORS TO ALL BUT INSTITUTIONAL AND EXISTING RETAIL TRADERS (continue reading for more information).>
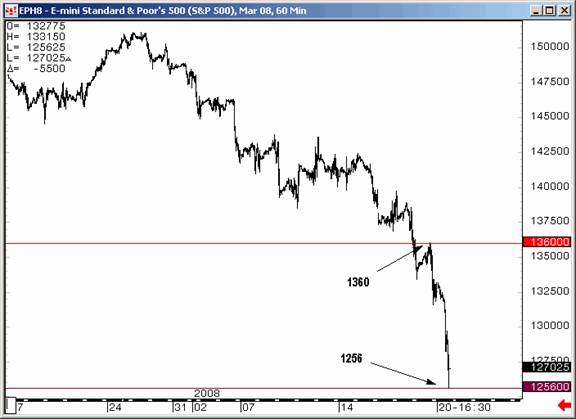
But in true unbiased tradition, it didn't hurt our profit/loss statements that the market did the exact opposite of what it appeared ready to do a few months back. And if you're a nimble trader, you, too, made a lot of money on this week's profound volatility. Remember the entire point of last week's update was to say that trading below 1360 was a “wake up call” and that we were prepared to be bearish on the market below this crucial trigger level, which was roughly where the market closed the previous Friday. That same level continued to be valuable this week as it was validated by market vibration. But selling 1360 was the easy part. The hard part for most traders was not getting caught selling into the bottom.
As we worked on the holiday morning to plan Tuesday's action, it was a real eye-opener to see the market down so far so fast, though we embraced the likelihood of bearish action and even capitulation. As soon as we saw the huge declines, however, TTC members focused on the target we'd identified (but reserved for members) on the initial failure of 1360. To be honest, I didn't expect we'd reach 1256 so quickly, but it was an obvious level for the market to attempt support since it was a huge “make or break” point and dropping from there would have created a catastrophic downward spiral. We were prepared as I had posted the following statement the Friday before. “if we could gap down on Tuesday a few hundred Dow points, you will be looking at a great chance of a low.”
For anyone focused on the “top” being in, the imperative in globex Monday or at Tuesday's open would have been to sell, sell, sell, expecting a continuation gap and who knows, maybe the end of the world. For the unbiased, for the trader focusing on the next move instead of a top or a bottom, buying 1256 was a reasonable risk/reward trade that could be managed without much anxiety by using a reasonable position size and a stop. The chart below was posted Monday morning and shows the reaction to 1256 in the S&P Futures in globex.
Our target proved to be the exact low of the week in the futures. The bounce in globex, though, didn't prevent the markets gapping down huge Tuesday morning and it made me wish brokers did more to educate their clients. If you're trading leveraged futures you have to understand the risk of being caught in a position when a market goes into a lock limit. At TTC we did everything we could to get the appropriate information out to our members and help them avoid a very dangerous situation, but I doubt everyone was so lucky.
As I said, being short below 1360 was the easy part – getting long while everyone is talking bear market and the TOP is in, that's what distinguishes unbiased traders from everyone else in the market. We got the opportunity to prove that again as the futures looked to retest their lows. Using a proprietary count developed during the week in response to the dramatic developments in the market, we took a small long at what proved to be the exact low of the day. Little did we know at the time that we were getting on board what will probably be one of the largest single moves of the year!
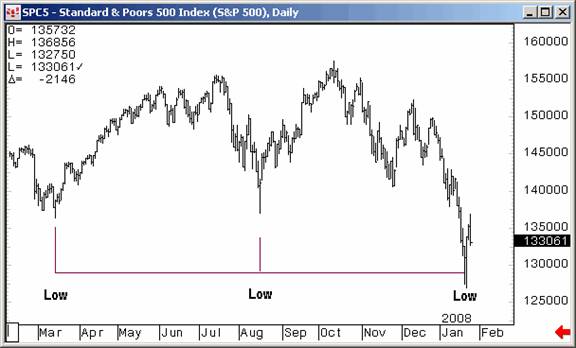
This week's low happen to also be on a Low to Low to Low cycle pattern as can be seen in the chart below. All the ingredients came together this week as we executed our plan.
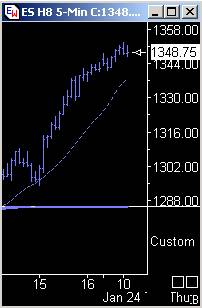
Our original target for the rally was anywhere from 1308-1319 but, as we reached these areas, every place we looked to take profits was simply run over so we went to the higher targets. The proprietary trend cycle chart above is just one of the many indicators that do a remarkable job in weeks like this and give us a real edge in our trading. The clear signal in this 5-minute chart, with the trend oscillator pinned to the top of its range, is to stay long!
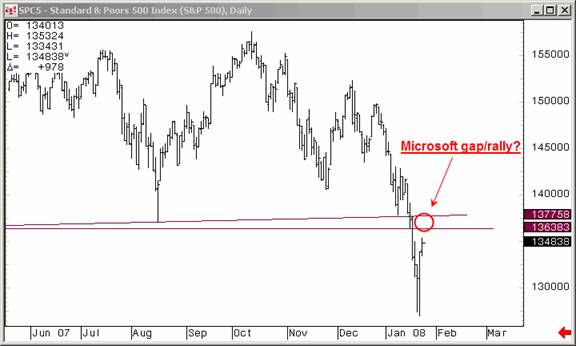
The higher levels were 1333 as a potential target, then 1340. Getting beyond this level going into the cash close we suggested taking profits, but for those willing to take on a little risk, we speculated on a Friday gap up opening based on Microsoft's earnings report and, as shown in the chart below, Friday's high at 1368 fell exactly in the range. As you may have guessed, losing 1360 soon after got us out of all long positions, if not already, and gave us another chance to capture points on the downside. Of course anyone assuming a bottom had been put in two days before missed this opportunity.
All told, Wednesday's amazing and unexpected 70-point rally would have netted $35,000 on 10 contracts within a few hours. And many of our traders captured more points than on the whole week. Congratulations to our senior contributor,
Craig, as he posted this right before leaving for a well deserved restful weekend,
“ I had my best week that I've ever had in my life....”
To be unbiased one needs to have good knowledge of the big picture. As mentioned in a recent update, every week at TTC begins with a look at charts in larger time frames as a resource for members with longer time frames and also to encourage our traders to get their noses out of 5-minute chart every so often. Managing multiple time frames, knowing where you are and where you've been, that's what allows you to be consistently correct.
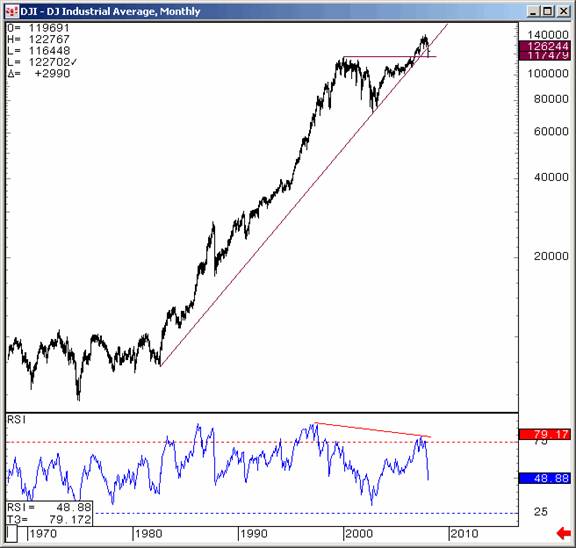
The chart above is an updated version from this week of a trendline we've been watching since our inception. Members were alerted in advance at the possibility of seeing a test of the last top in the Dow at 11750. Seeing this sort of obvious long term support potential, in addition to our proprietary trend charts and 1256 S&P target went a long way towards easing the anxiety of going long amidst the panic and uncertainty. Another useful contribution to our analysis came from friend and colleague Bob Carver , who's proprietary put/call ration showed an extreme reading on Tuesday's opening, further suggesting the buy.
Many were unable to buy the lows this week, for whatever reason, but that's behind us now. I don't believe the next direction for this market has been decided and, of course, we have a Fed meeting next week and it will probably trigger our next big move. Normally I'd say break out the pillows for slow pre-announcement trading, but that's not likely this time around. Cut your losses quickly and let your winners run because we're likely to see the tug-of-war continue next week, all week.
Regardless of what the Fed does, the market's response will be dictated by either the bulls or the bears, whichever side has the upper hand at that point. But don't let that freeze you up, either – the chart above suggests an obvious strategy. Above is the kissback to the multi-year trendline and resistance their can be very dangerous. Below is the recent lows, and between that is trading. Bias here can be deadly!
So, do you want access to the charts posted in the weekly forum right now? Already in the past three months we've caught the October high exactly to the tick, traded the 3 month consolidation, anticipated the sell trigger at 1360, and called the exact low of the year so far at 1256. If you feel the resources at TTC could help make you a better trader, this is your last chance to join at current prices!!! TTC will be raising its monthly membership fee in February and will close its doors to retail members sometime in the first half of the year. Institutional traders have become a major part of our membership and we're looking forward to making them our focus as we offer the best analysis on the web.
If you're a retail trader/investor and want to take advantage of our proprietary targets, indicators, forums and real time chat this is the time to join before the lockout starts, and if you join now, you can still take advantage of the current low membership fee of $89. Once the doors close to retail members, the only way to get in will be a waiting list that we'll use to accept new members from time to time, perhaps as often as quarterly, but only as often as we're able to accommodate them. Don't get locked out later, join now!
Have a profitable and safe week trading, and remember:
"Unbiased Elliott Wave works!"
By Dominick , a.k.a. Spwaver
www.tradingthecharts.com
This update is provided as general information and is not an investment recommendation. TTC accepts no liability whatsoever for any losses resulting from action taken based on the contents of its charts, commentaries, or price data. Securities and commodities markets involve inherent risk and not all positions are suitable for each individual. Check with your licensed financial advisor or broker prior to taking any action.
Dominick Archive |
© 2005-2022 http://www.MarketOracle.co.uk - The Market Oracle is a FREE Daily Financial Markets Analysis & Forecasting online publication.