Dow Jones Forecast - Double Bottom ?
Stock-Markets / US Stock Markets Jul 21, 2006 - 08:59 PM GMTBy: Nadeem_Walayat
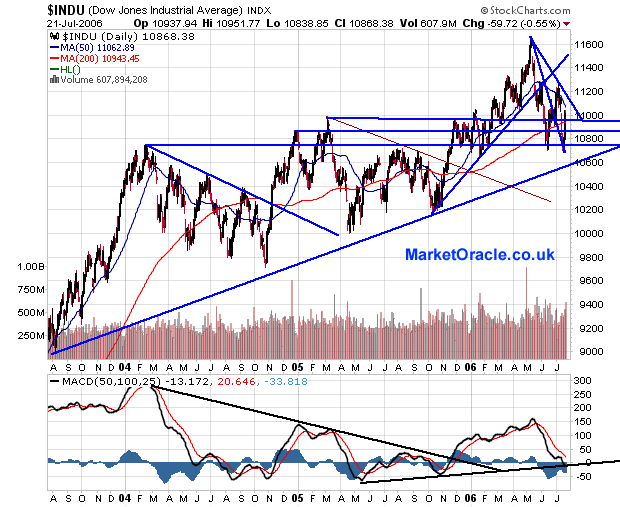
A month on from the FTSE double bottom, the same pattern can be observed forming on the Dow Jones 30 !
The correction during the summer was inline with the previous two corrections during the bull market in terms of price, though not time. But the key difference between this correction and the previous ones is that the Dow is now flirting with its all time high ! It failed to break on the first attempt and had a strong correction. The scene is set for another attempt on the high, with the second attempt more likely to succeed than the first attempt as the speculative forth has been unwound.

The correction during the summer was inline with the previous two corrections during the bull market in terms of price, though not time. But the key difference between this correction and the previous ones is that the Dow is now flirting with its all time high ! It failed to break on the first attempt and had a strong correction. The scene is set for another attempt on the high, with the second attempt more likely to succeed than the first attempt as the speculative forth has been unwound.
Technical Analysis
1. Price Patterns - A double bottom is forming, the size of which suggests an attack on the peak of about 11,680. For the pattern to hold then the trend should continue higher from here and definitely the low at 10660 should hold ! though for the trend towards 11,700 the Dow should not revisit the lower end of the pattern. The classic price action is to break above the neck, and then re-enter the double bottom price range but not cross below half way, or about 10,950..
Resistance - Resistance is at the double bottom neck or 11,250, a break of this confirms the pattern and suggests a move towards the high of 11,680.
2. Support - Support is along the congestion zone mid way of the double bottom pattern i.e. around 10,950. Key support is at 10,660 which if breached would signal much lower prices ! MUCH LOWER !
3. MACD - (Bottom indicator) - The MACD is hitting the uptrend line which suggests that the correction is over.
5. Uptrend Line - So far the correction held above the support trendline which suggests trend and a resumption of the bull trend.
6. Time - This is the only weak point, as the market time wise is likely to remain weak into September, so the trend up towards 11,680 may be very choppy?
Conclusion - The price pattern supports a resumption of the trend to the 11,680 high.
Buy Trigger - The Primary buy trigger is a break of 11250, though as is consistent with this type of pattern a reaction back below the breakout point is expected.Target - The Target is the previous high 11,680, with a high probability that an assault on it will break higher.
Stop-Loss - The stop loss would be a distant 10,660 i.e. below the pattern lows.
Nadeem Walayat
(c) MarketOracle.co.uk 2005-2006
Disclaimer - This Forecast / Trade Scenerio is provided for general information purposes only and not a solicitation or recommendation to enter into any market position, and you are reminded to seek independent professional advice before entering into any investments or trading positions.The Market Oracle is a FREE Financial Markets Forecasting & Analysis online publication. We aim to cut through the noise cluttering traditional sources of market analysis and get to the key points of where the markets are at and where they are expected to move to next ! http://www.marketoracle.co.uk
This article maybe reproduced if reprinted in its entirety with links to http://www.marketoracle.co.uk
© 2005-2022 http://www.MarketOracle.co.uk - The Market Oracle is a FREE Daily Financial Markets Analysis & Forecasting online publication.


