


Stock Market Low Forming
Stock-Markets / Stock Markets 2012 Jun 04, 2012 - 06:10 PM GMTBy: Andre_Gratian

 Current Position of the Market
SPX: Very Long-term trend - The very-long-term cycles are down and, if they make their lows when expected (after this bull market is over) there will be another steep and prolonged decline into late 2014. It is probable, however, that the steep correction of 2007-2009 will have curtailed the full downward pressure potential of the 120-yr cycle.
SPX: Intermediate trend - Correction nears end.
Analysis of the short-term trend is done on a daily basis with the help of hourly charts. It is an important adjunct to the analysis of daily and weekly charts which discusses the course of longer market trends.
Market Overview
The failure of the interim rally to make more headway, and the climactic nature of Friday's move -- which brought the SPX near the upper range of my intermediate price projections - has somewhat altered the market scenario that I had proposed. Fine-tuning forecasts is something that the analyst must be prepared to do. In this case, the SPX is getting down in the projection area faster than anticipated, but it has not changed my overall perspective.
I had expected that the cycles bottoming in this time frame would provide the basis for an extension of the interim rally, but I obviously underestimated their strength. Of course, one cannot ignore the role that was played by the disappointing jobs report. The reason does not matter, it's the market action that counts.
Based on the distribution pattern that formed at the top of the move from 1075, I had valid Point & Figure counts ranging from 1233 to 1265, depending on where one starts and ends the count. Subsequent market action always provides opportunities to refine targets and, as it stands, P&F counts taken from the last distribution phase and Fibonacci projections taken from various levels are targeting the 1255 to 1265 price range. This is a potential area where the decline could end.
Does the market action suggest that it could reverse in that area? Actually, yes. Positive divergence is appearing in the daily momentum and breadth indicators, and a number of confirming indices are reaching the price projections, but we must give the market a few days to confirm that it is, in fact, making a low.
As mentioned above, there are several cycles which will have bottomed after a few more days. The SPX also needs a little more time to reach its potential objective and complete whatever structural pattern is being formed. The wave count may be complicated by the fact that the SPX made its high on 4/02 and the DOW on 5/01. But I'll let the EW experts sort that out.
The weekly indicators are not as ready to signal a low as the daylies. This could mean that the reversal that should be experienced over the next few days will only be of a short-term nature. An intermediate bottom may take longer to carve out. I had suggested earlier that we could rally into mid-June and make our final low in July/August. That could still be the case.
Chart analysis
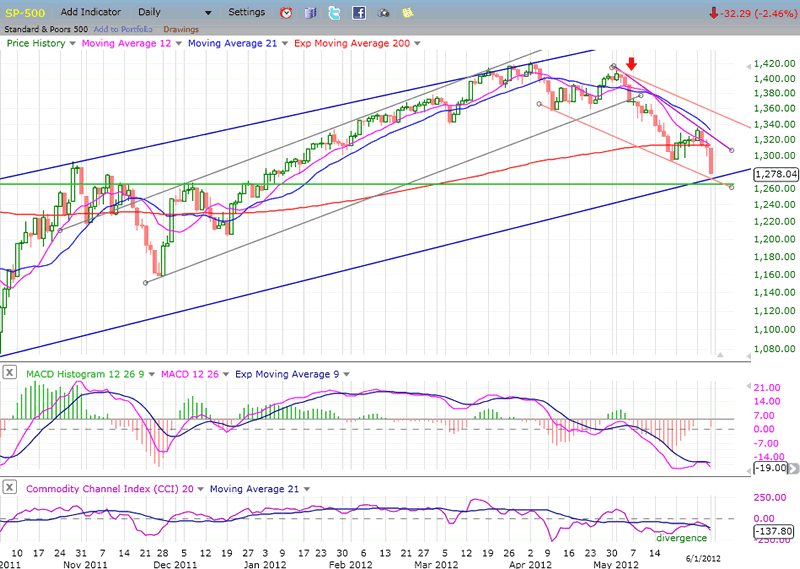
As a result of Friday's decline, the SPX has now retraced nearly the entire width of the blue channel, which I thought would be necessary before it could end its correction. The green horizontal line represents a strong support level that happens to coincide with the projection cluster mentioned above.
Both indicators are now showing some positive divergence which will have to be preserved while the index completes its correction in order to signal that a reversal is at hand. To resume the intermediate uptrend, prices will have to move out of their down channel. And, if they are to overcome the former bull market high, they will have to form a Point & Figure base pattern which has enough of a count to enable them to do that. Since the base looks as if it is just beginning to form on the P&F chart, we are a long way away from making that determination.
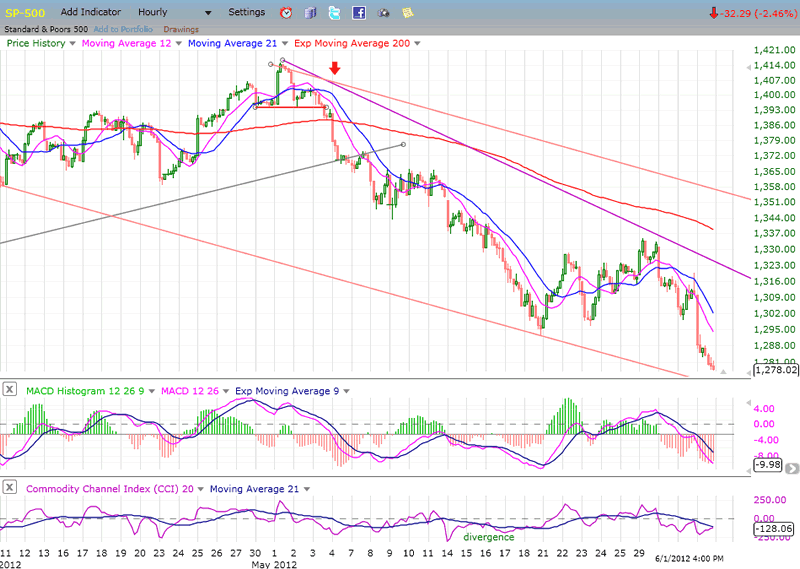
The Hourly Chart also tells us that the SPX is probably not quite done with its correction. Everything is still pointing down and we don't even have any deceleration in the price pattern. Only a very small hint of it shows up in the lower indicator.
The same corrective channel that I pointed to on the daily chart is also drawn here. Before it can be challenged, the price pattern will have to move away from the bottom and start to show some deceleration. The structure of the last wave seems to indicate that we are currently in a wave 3 of the final wave 5 from 1415. That would mean that we need another small rally for wave 4, followed by another decline. If this gets us to the projection area proposed above, it will be a good time to look for a reversal. By then, the hourly indicators should be ready to show some positive divergence and, if the daily indicators have retained theirs, we should look for downtrend lines to be broken.
Cycles
The 33-wk cycle which bottomed last week should still be in an uptrend for several more weeks. It was probably temporarily overwhelmed by the Kress cycle which, according to Clif Droke, accounts for the recent weakness and was due to make its low on 6/1.
We also know that another smaller, but significant cycle bottomed last week and I am expecting one more to make its low over the next couple of days. After the last one has bottomed, there should be enough combined strength from this cycle cluster to move prices upward in a decisive way.
Another 2 or 3 more cycles ending their phases in mid-June could turn out to be either a high or a low. We'll let the market decide. (A high would better fit in the envisaged scenario.)
There is a 2-yr cycle which bottoms around July every other year that is due again this year. That may be a good time for the market to make an intermediate low.
Breadth
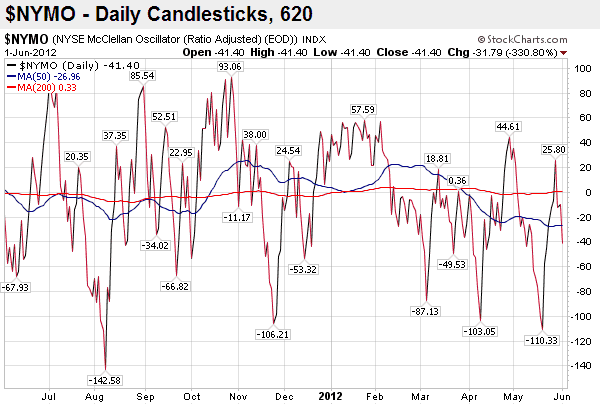
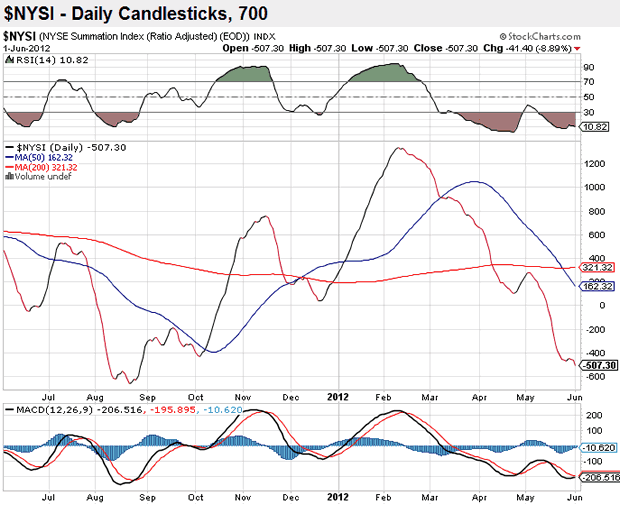
Below, I show the NYSE McClellan oscillator (NYMO) as well as the NYSE Summation Index (NYSI), both courtesy of StockCharts.com.
The NYMO briefly got back into positive territory but, with Friday's weakness, it went negative again. However, it remains quite a bit above its former low while the SPX made a decisive new low. That is the type of positive divergence that normally appears at a market turning point.
Like the weekly momentum indicators, the longer term is not quite as bullish because the NYSI made a new low along with the SPX on Friday. This index has the habit for showing some clear positive divergence at intermediate lows, and this makes me think that we may only be making a short-term low which might have to be exceeded later on. July-August would be a good time to do that in conjunction with the bottoming of the 2-yr cycle.
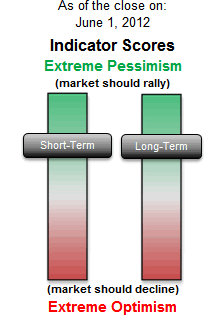
Sentiment Indicators
The SentimenTrader (courtesy of same) is not quite as bullish as it was on 5/18 when the long-term indicator went to an extreme. But, along with the short-term index, it is still solidly in the green, favoring a short-term low.
The VIX
VIX is getting close to the end of the run which it started at the end of May. This shows up in the fact that it was not able to get up to the top of the channel on Friday, in spite of the market weakness, and that the CCI is showing negative divergence. But like the SPX, which does not seem to be at a significant low, the VIX does not yet appear to be making a significant high.
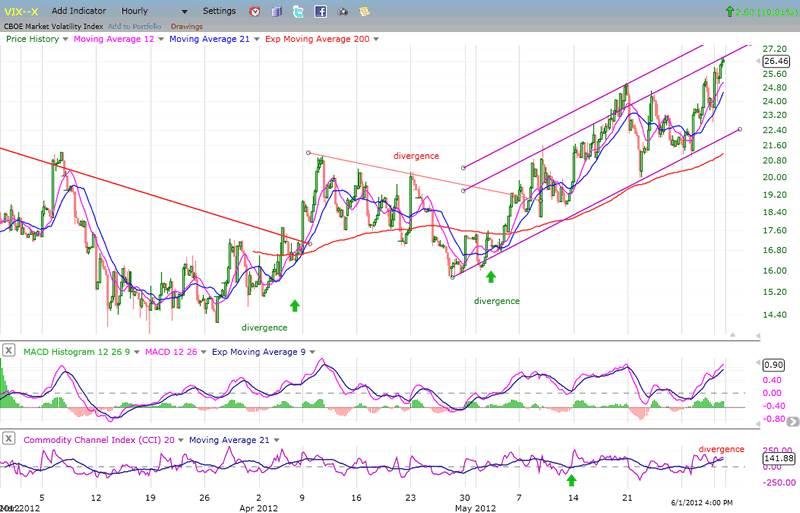
Over the next few days, it will have a chance to tell us if the SPX is ready to make a low. It has the habit of showing divergence when the SPX is about to reverse. None appears at this time.
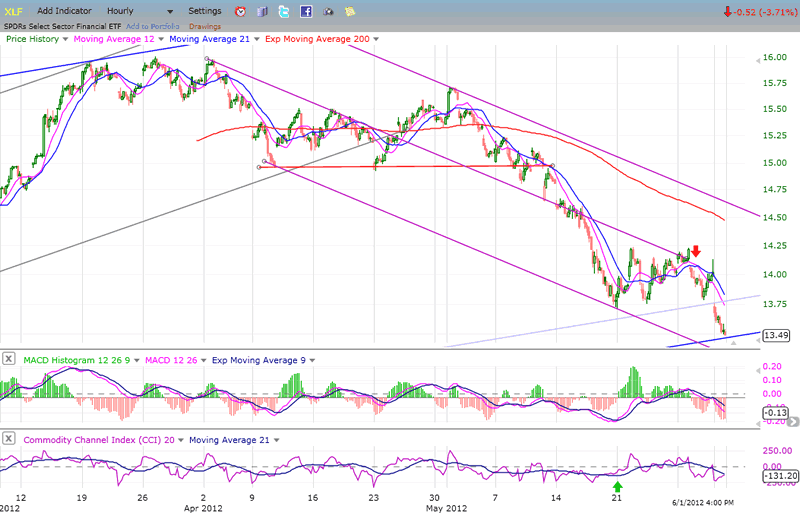
XLF (Financial SPDR)
If you placed the hourly chart of XLF next to that of the SPX without price or symbol labeling, you might find it difficult to tell them apart - unless you looked closely at how each trend ended. If you did that, you would find that the XLF usually signals a turn in the other index by showing some slight divergence. It becomes much more obvious when comparing longer trends. As an example, at the 2007 top XLF stopped rising and started declining months ahead of SPX. On an hourly chart, the deviation is far more subtle.
Scrutinizing Friday's low, there is no difference of pattern, which suggests - like everything else - that we are not quite there, yet.
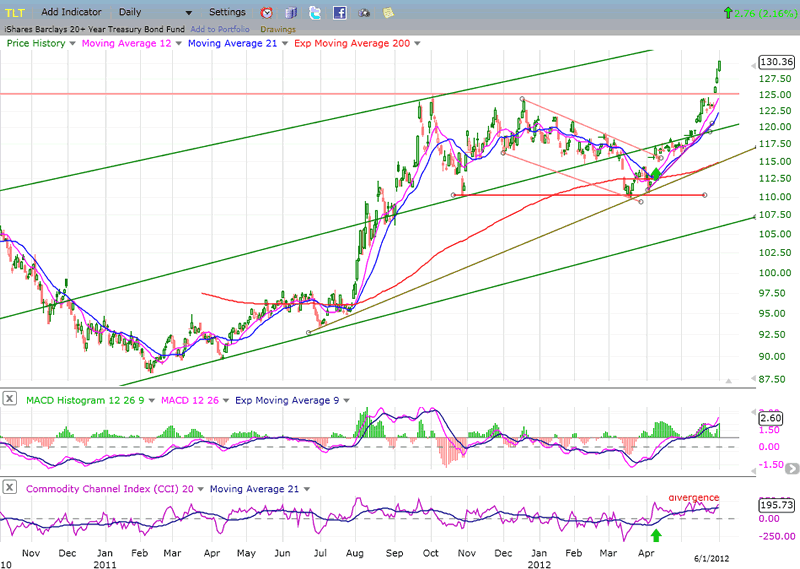
BONDS
Analyzing TLT in the last newsletter, I mentioned that "On the P&F chart, there is a potential count to 129." Actually, 133 is a better phase count. Having already closed above 130 on Friday, TLT seems quite capable of meeting that target before the SPX finds its low. It also appears capable of reaching 137, but that could be later. For now, 133 may be all we get.
The price move is looking climactic, matching that of the market but in the opposite direction. This is how TLT ended is previous move to 125, so we should be on the look-out for another short-term top around the 133 projection. We can discuss its longer-term prospects at a later time.
UUP (Dollar ETF) Daily Chart.
I have placed the FXE chart below UUP so that you can compare the inverse similarity between the two charts.
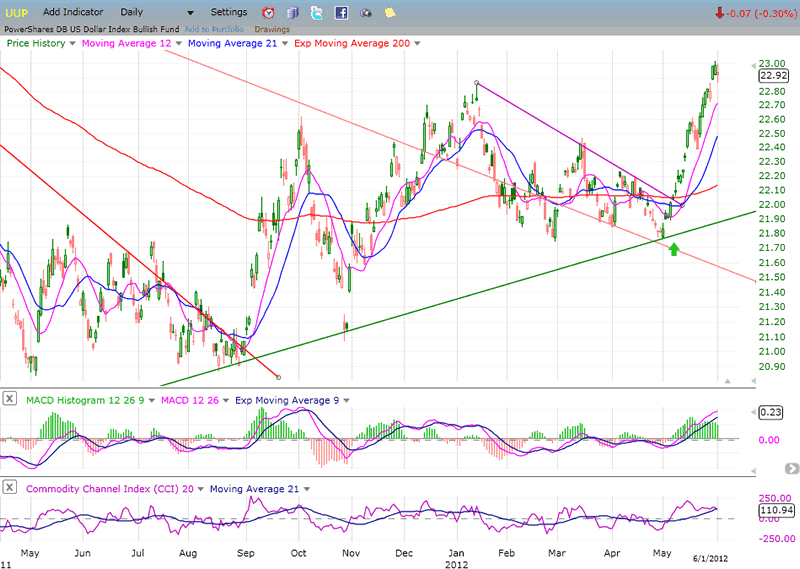
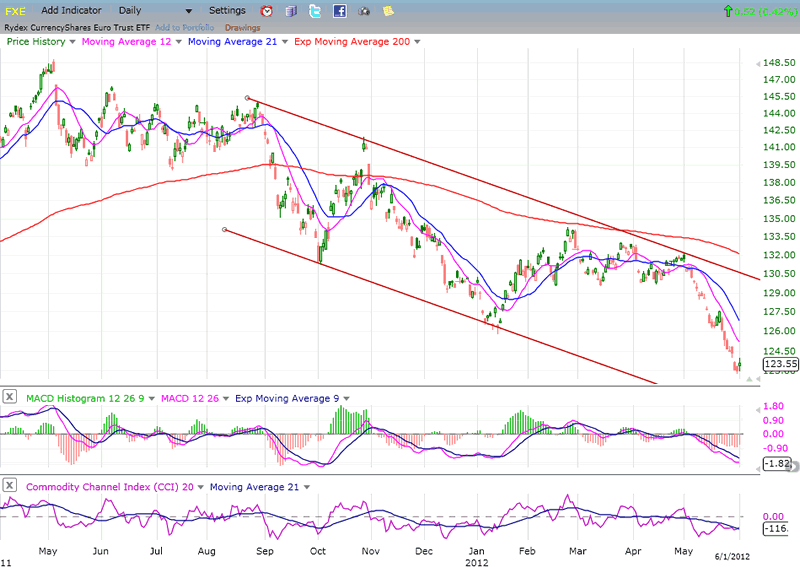
UUP had an initial projection of 22.80, but it has already surpassed it by going to 23.02. It could even go to 23.30 before consolidating. FXE has a projection to 122 which has been approximated with a low of 122.75. There is no clear sign that it is ready to reverse, so it could go a little lower.
Both indices appear ready to pause before going for their final targets.
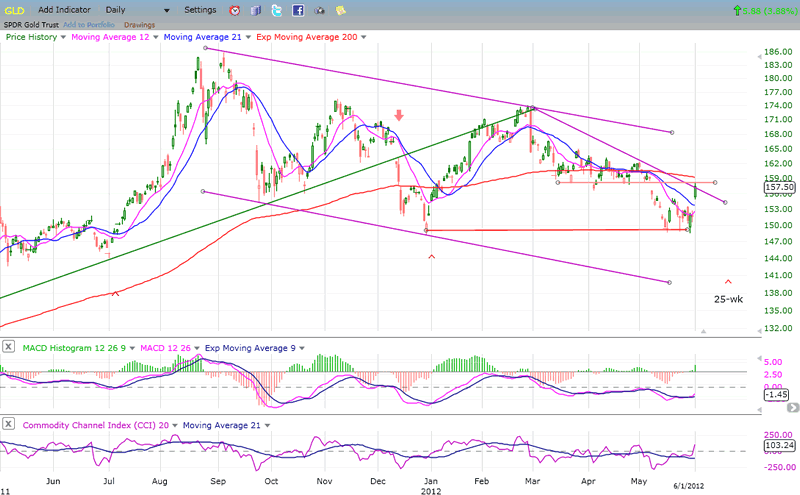
GLD (ETF for gold)
GLD is another index which is affected by the dollar and the EURO. It formed a small base at the level of its former 25-wk cycle low and has been waiting for the dollar to finish its rally so that it could, itself, rally. GLD seems to think that the UUP has reached a top, but this may be a little premature.
GLD is one of the indices that "counts" well. The short-term base that it formed at 149 is comprised of two phases with a total count of 162. The first phase projected to 157, and GLD took only 3 days to get there after touching 149 for the third time. After a pause, It will probably reach 162 but then may continue to consolidate. There is a lot of resistance between 158 and 164. Also, it may not be able to extend its move until after its 25-wk cycle makes its low. That low is due on 6/20, which makes one wonder if that time frame is not going to be another low for the market instead of a high.
If GLD can hold 149, it stands a good chance of getting back into an uptrend by coming out of the downward slanting channel which has defined its intermediate correction. If it breaks below 149, it would probably drop to its long-standing target of 141.
OIL (USO)
In the last newsletter, I mentioned that USO had a near-term target of 34, and a longer-term one of 30.50. The index has knifed through all support levels in order to get to that lower projection and seems determined to reach it ASAP. It's likely that it will have to fill that count before it can start consolidating. WTIC has a concurrent target of 82 which is now just a little over one point away.
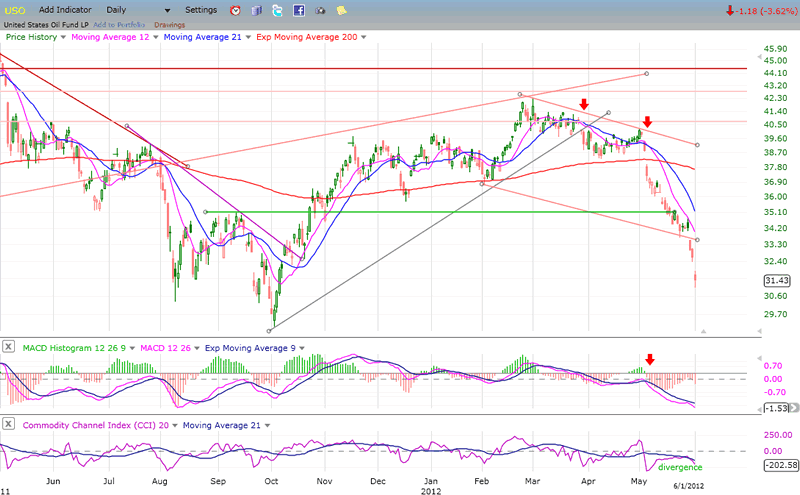
Copper is equally weak but, at 42.26, it is still about 3 points away from its near-term target.
The substantial weakness of these commodities makes one wonder if the top of the 2009 bull market which was "expected" in October has not already been reached. The future market action will let us know!
Summary
Coming after an extended decline, Friday's action has all the earmarks of a selling climax in the making. Best guesstimate is that it will reach the suggested 1255-1265 projection before reversing.
That may be only the first phase of a two-step reversal leading to several weeks of base-building, potentially followed by a marginal new low.
The 2-yr cycle low due in July/August could bring about a more substantial reversal than the one which could come as early as next week.
FREE TRIAL SUBSCRIPTON
If precision in market timing for all time framesis something that you find important, you should
Consider taking a trial subscription to my service. It is free, and you will have four weeks to evaluate its worth. It embodies many years of research with the eventual goal of understanding as perfectly as possible how the market functions. I believe that I have achieved this goal.
For a FREE 4-week trial, Send an email to: ajg@cybertrails.com
For further subscription options, payment plans, and for important general information, I encourage
you to visit my website at www.marketurningpoints.com. It contains summaries of my background, my
investment and trading strategies, and my unique method of intra-day communication with
subscribers. I have also started an archive of former newsletters so that you can not only evaluate past performance, but also be aware of the increasing accuracy of forecasts.
Disclaimer - The above comments about the financial markets are based purely on what I consider to be sound technical analysis principles uncompromised by fundamental considerations. They represent my own opinion and are not meant to be construed as trading or investment advice, but are offered as an analytical point of view which might be of interest to those who follow stock market cycles and technical analysis.
Andre Gratian Archive |
© 2005-2022 http://www.MarketOracle.co.uk - The Market Oracle is a FREE Daily Financial Markets Analysis & Forecasting online publication.