


Stock Market SPX Technical Analysis
Stock-Markets / Stock Markets 2012 May 24, 2012 - 03:59 AM GMT

This is an update on the technical comment regarding the S&P500 (symbol: SPX).
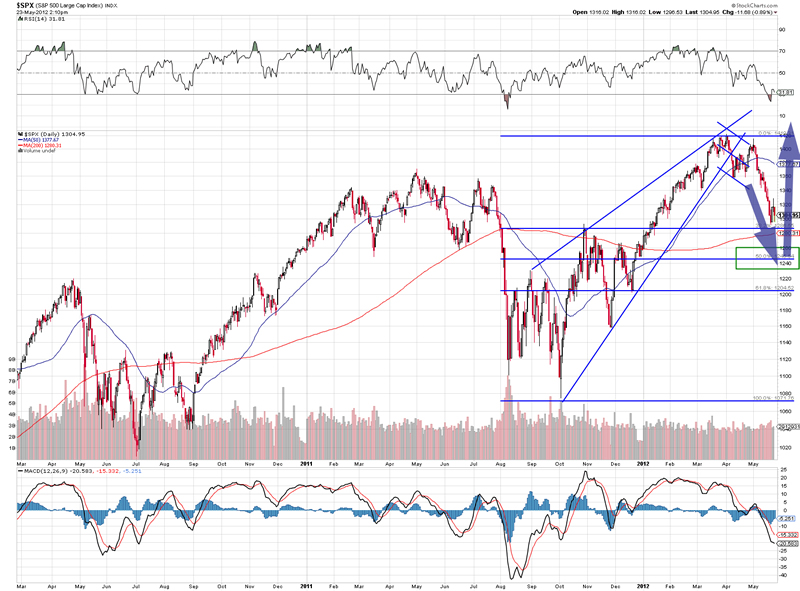
- In my last update of about 4 weeks ago I wrote the following: “An ascending wedge has formed in the past months. This represents a fairly reliable pattern in the S&P500 as well as the German DAX large cap index. Other indices display a less reliable reaction to that pattern but may follow suite to those two leading stock indices. The pattern typically (but NOT always) is characterized by high speed corrections. The current year long rally looks quite tired and is coming to an end. Expect a corrective decline………..”
- The market development has followed my forecast and has quite advanced with its correction since I last updated my comment. The current decline is not over.
- The first target zone of the expected correction is the green rectangle on the chart. This is major support and should trigger a multi-month rally once reached. This assumption of course is subject to the hoped for lack of any negative external factors. Shock reactions in the market to unforeseen events can drive markets usually lower than any technical targets would indicate. The Greek mess seems to be priced into the market at this point and should not worry investors too much.
- Time: time the current decline should take is anything between 23% to 48% of the time it took to complete the rally since the low in July 2011. This puts the anticipated end of the correction somewhen into the end of June to mid-September. A large range admittedly, but looking into the big crystal ball is a bit difficult at this point in time for one reason: the summer months are ahead of us during which trading usually slows down significantly and might drag out this decline.
- In my last update I wrote: “A pennant has formed (please see formation at the start of the left green arrow). An a-b-c pattern looks almost complete and should be followed by further selling. A break below the pennant may be a good short opportunity with stops very close by. Another technical possibility is the test of the highs of the wedge followed by a decline.” Anyone who has followed the “short” recommendation should have earned some money by now. Continue to short but keep stops close by.
- FUNDAMENTAL FACTORS: the following fundamental factors may influence the technical expectations.
- It is election year and traditionally election years in the US have been up-years with quite a positive stock market balance.
- By consensus of all reasonable people we have a very significant inflationary problem in the leading economies. This means more upside for gold and stocks.
- CONCLUSION: Expect a continued decline into the target zone marked by the green rectangle, followed by a rally (later this year) above recent highs. See the purple arrows for a first indication. I will comment on commodities and particular gold in the next couple of days whenever I have time.
- DISCLAIMER: all the usual disclaimers apply, in particular do your own research please and don’t rely on me for investment decisions. I am using mathematical FEM methods not depicted here to come to certain conclusions and while these work for me most of the time they may not be suitable for everyone.
By Volkmar Hable
volkmar@hable.ca
If you would like to send me a message please use the contact form on www.samariumgroup.com
Dr. Hable is a physicist and geoscientist by training and in addition holds a B.Sc. in Agriculture and Agronomics. In 2011 he has been appointed Consul for the Republic of Guinea.
From 1996 to the beginning of 2001, he was the CEO for a part of the European operations of Adecco, a Swiss $20 billion dollar Fortune 500 Company where he managed its offices in Europe and some parts of Asia comprising of 6,000 employees. From 2001 to 2009 he was a fund manager and asset advisor for STG Ltd, a private Swiss 700 million Euro fund focusing on energy, commodities and resources; during this time Dr. Hable managed to achieve an annual average net return of 19.8% with no down year. In December 2011 the Swiss group awarded him with the Liftetime Fund Manager Award. Previously he held senior executive positions in the oil exploration industry, the Diplomatic Corps, and a global Engineering Consulting Company.
Copyright © 2012 Dr. Volkmar “Marc“ G. Hable - All Rights Reserved Disclaimer: The above is a matter of opinion provided for general information purposes only and is not intended as investment advice. Information and analysis above are derived from sources and utilising methods believed to be reliable, but we cannot accept responsibility for any losses you may incur as a result of this analysis. Individuals should consult with their personal financial advisors.
© 2005-2022 http://www.MarketOracle.co.uk - The Market Oracle is a FREE Daily Financial Markets Analysis & Forecasting online publication.