Stock Market Wake-up Call
Stock-Markets / US Stock Markets Jan 21, 2008 - 07:39 AM GMTBy: Dominick
 Two years ago I made a call that anyone who's read this newsletter long enough will remember or at least have heard about. In July 2006, with the market at multi-month lows, TTC got long the S&P futures for a move to 1360 that seemed incredible at the time – certainly no one else was seeing it, let alone trading it. But, by October the S&P futures had rapidly advanced 200 points and my target was hit.
Now, of course, the fall rally of ‘06 is practically legendary, having extending into early 2007 until the first hints of a subprime mortgage problem began to trigger the first waves of panic selling. As 1360 was reached and the market continued to pull away after some initial confirmation and vibration there, I forewarned that this important level would inevitably be retested from above. Sure enough the March 2007 low and, later, the August 2007 low were retests of 1360. On both occasions, 1360 held and, proving support, launched the market to new highs.
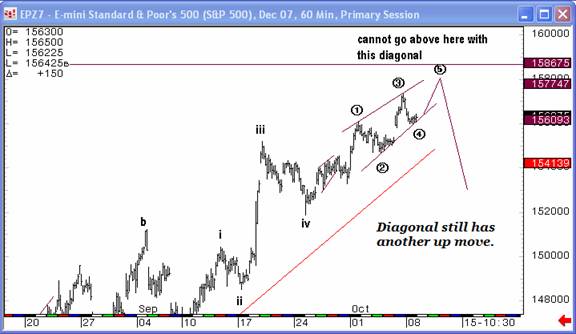
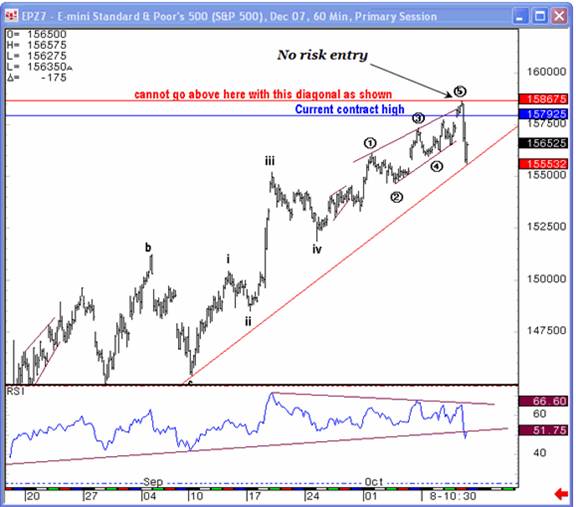
In October of 2007 , I went against the grain and called what is so far the exact all-time top of the market to date with a fantastic ending diagonal that stretched to the extreme limit at 1586.75. The charts below show the expectation going into the move and the rapid confirmation we got of our no risk entry. Selling the top tick was excellent, of course, because of the rapid waterfall move that gave us a handsome profit that week in a matter of minutes. But calling market tops and bottoms is not my goal, it's not even what I'm trying to do, frankly because it's not typically a money-making proposition.


When the move off the October highs ceased looking impulsive we got off the move and started to trade it as a large triangle, a pattern that eventually became obvious and overcrowded, but not before we were able to take hundreds of points trading the huge legs. The beauty of having a pattern like this before the rest of the crowd is that it's fairly predictable and, even if the pattern breaks, one way or the other, you already have gains going into the break and can get back on, or you can ride it through and catch even more of the move.
Well, the triangle finally did breakdown and now the bears are feeling pretty good, having the upper hand and more than 250 points from the October high. But, though I did not treat that turn as THE top and simply stay short the entire period from that day, make no mistake, I wouldn't have traded this move any differently than I did. Between October and here was a long period consolidation and it was traded profitably at TTC every day.
Overall, our traders are loving the fast and hard moves of this volatility, but swing traders may be feeling left out if all they see is the bears with party hats on and the media showing the year-to-date losses in the major averages. Think about it: trading the triangle's ups and downs for several months many TTC members were able to take 700-800 points, while for most of the time the net move for the market was less than half that. For example, a few weeks ago the S&P dropped 35 points, but because we didn't have the right setup, we didn't do any better than the broad average. The next day, though, was the one that closed roughly flat but had 75 intraday swing points for unbiased traders.
Combined, over those two days our traders did far better than the S&P, but some were still sore about missing the big day. This unproductive mentality probably comes from trying to mentally compete with the indices like you're a mutual fund, but I learned long ago the only thing that mattered was my personal Profit and Loss statement and my own goals. Now I only care about my daily or monthly performance and, ironically, that usually keeps me outperforming the S&P on a monthly basis.
Though I've been mentioning it for weeks, it should finally be dawning on market participants that lasting outperformance in this market will only come through trading. If you don't trade, which I'm not sure why you wouldn't with the 2- to 3-day swings now worth about 50 points, but if you were looking to get long after October you would've had to wait almost the whole fourth quarter of '07 for the triangle to finally break to the upside, which it never did! Bears probably got taken out of their short positions by the snapbacks, and it's unlikely anyone was short the whole way down since there weren't many bears around when we called the October high, unless you count the ones who've been shorting every potential top along the way from 2002, Yikes!
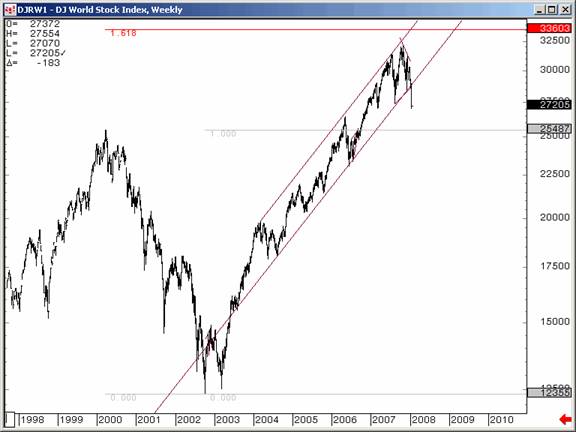
So, the only "stay short" trade came last week, but now at this point, the correct trade might not be to go with the crowd. Looking at the Dow Jones World Stock Index chart below, it's highly unlikely that professional traders were short in front of a triangle pattern and a major multi-year trendline. We also had the 2003 trendline from last week's update that did get broken this week. Still, I don't believe this move down from the top has come with a lot of bears riding it, and now everyone is jumping on the short trade looking for that home run short while the market could be setting up to blast up, even if only a bear market rally.

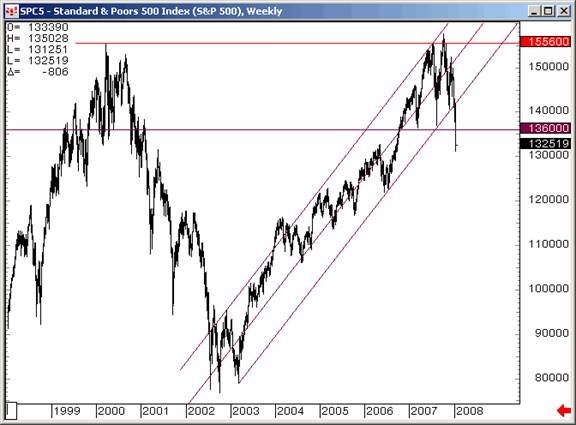
Don't be fooled – counting the October high as THE top has complications. The move down from that high has complications. But, maybe, just maybe we live in a complicated world and will have to deal with the imperfections in the charts. But maybe not. I don't believe the outcome between the bulls and bears has been decided yet and my focus will be on the market's response to a kissback to either the 2003 trendline or 1360, for the answer. And this past Friday morning was a perfect example of how we'll use these two major areas going forward. Remember Globex made a hard rally overnight to open the market right in the area of 1360. It was clear we were going to either use this area as support or breakdown from it. As it was, traders got a chance to make a nice return shorting Friday's open and catching a big move down without having to bury money in short positions for months or weeks at a time.

In my work, the break of 1360 is alarming. As you can see, it tested it in March and August of last year, but has now closed below. We're either going to trade back above it fast or respect the failure and get aggressively short. But the bottom line is that 2008 is still a year to trade the markets and not a "2000-2002 hold then to the bottom" year unless the economic or political climates radically change. In the meantime, the break of the trendline from 2003 and the loss of 1360 constitutes a wake-up call that says the bears have the upper hand and the pressure is on the bulls to prove any upward moment is more than a kissback that fails dramatically to deeper lows.
Do you want access to the charts posted in the weekly forum right now? If you feel the resources at TTC could help make you a better trader, don't forget that TTC will be raising its monthly membership fee in February and look to close its doors to retail members sometime in the first half of the year. Institutional traders have become a major part of our membership and we're looking forward to making them our focus. If you're a retail trader/investor the only way to get in on TTC's proprietary targets, indicators, forums and real time chat is to join before the lockout starts, and if you join before February, you can still take advantage of the current low membership fee of $89. Once the doors close to retail members, the only way to get in will be a waiting list that we'll use to accept new members from time to time, perhaps as often as quarterly, but only as often as we're able to accommodate them. Don't get locked out later, join now.
Have a profitable and safe week trading, and remember:
"Unbiased Elliott Wave works!"
By Dominick
www.tradingthecharts.com
If you've enjoyed this article, signup for Market Updates , our monthly newsletter, and, for more immediate analysis and market reaction, view my work and the charts exchanged between our seasoned traders in TradingtheCharts forum . Continued success has inspired expansion of the “open access to non subscribers” forums, and our Market Advisory members and I have agreed to post our work in these forums periodically. Explore services from Wall Street's best, including Jim Curry, Tim Ords, Glen Neely, Richard Rhodes, Andre Gratian, Bob Carver, Eric Hadik, Chartsedge, Elliott today, Stock Barometer, Harry Boxer, Mike Paulenoff and others. Try them all, subscribe to the ones that suit your style, and accelerate your trading profits! These forums are on the top of the homepage at Trading the Charts. Market analysts are always welcome to contribute to the Forum or newsletter. Email me @ Dominick@tradingthecharts.com if you have any interest.
This update is provided as general information and is not an investment recommendation. TTC accepts no liability whatsoever for any losses resulting from action taken based on the contents of its charts, commentaries, or price data. Securities and commodities markets involve inherent risk and not all positions are suitable for each individual. Check with your licensed financial advisor or broker prior to taking any action.
Dominick Archive |
© 2005-2022 http://www.MarketOracle.co.uk - The Market Oracle is a FREE Daily Financial Markets Analysis & Forecasting online publication.


