Fed Statement To Set Market’s Tone
Stock-Markets / Stock Markets 2012 Apr 24, 2012 - 05:44 PM GMTBy: Chris_Ciovacco
 The markets advanced early Tuesday after a report on home sales exceeded forecasts. On the earnings front, AT&T (T) and 3M (MMM) came in above consensus. With an important Fed statement and a durable goods report coming on Wednesday, we will be monitoring our market models, support, and moving averages closely.
After the recent rise in Spanish and Italian bond yields, it is possible the market is expecting too much from Wednesday’s Fed statement. From a bullish perspective, any hint of additional Fed asset purchases in the central bank’s statement could give a tired market a bullish injection.
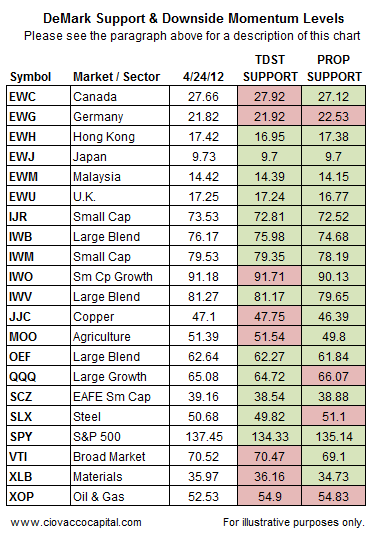
The support table below is one of the ways we are tracking the market’s downside risk should the Fed disappoint. The levels shown come from two DeMark indicators, Setup Trend (TDST) and Propulsion (PROP). All things being equal, we would prefer to see the ETFs in the table remain above both of the potential forms of support. Red boxes show ETFs that were below the given level as of Tuesday morning. Green levels show ETFs that were above the given level as of Tuesday morning. On average, the ETFs remained 0.16% above TDST support and 0.95% above the PROP support.

In the table above, a bearish break of the PROP “support” levels could be followed by increasing momentum to the downside. ETFs that remain above the PROP levels will tend to maintain a bullish bias from a momentum perspective. DeMark indicators are proprietary tools offered by Market Studies, LLC.
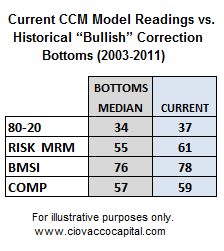
When we study markets, we tend to classify them as bullish, neutral, or bearish. A “bullish correction” is one that remains relatively tame or is relatively short in duration. As shown in the table below, the median CCM 80-20 Correction Index (80-20) reading at the end of a “bullish correction” was 34. The 80-20 closed Monday at 37. None of our models have moved from bullish to neutral territory yet, which means some patience remained in order as of Monday’s close.

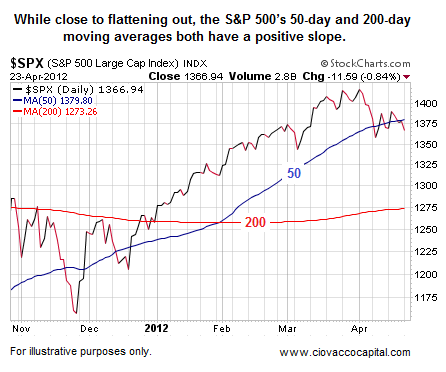
Should the values in the table above begin to breach neutral territory, it would increase the odds of a more substantial pullback. The CCM Asset Allocation model currently has a 67% exposure to risk, which respects the possibility of further downside while acknowledging all three major indexes remain above their 200-day moving averages (in red below).

Not too many bad things can happen when the slope of the S&P 500’s 50-day moving average remains positive (shown in blue above). If the 50-day does turn over in a negative manner, it will send another “be careful” message to investors.
-
Copyright (C) 2012 Ciovacco Capital Management, LLC All Rights Reserved.
Chris Ciovacco is the Chief Investment Officer for Ciovacco Capital Management, LLC. More on the web at www.ciovaccocapital.com
Ciovacco Capital Management, LLC is an independent money management firm based in Atlanta, Georgia. As a registered investment advisor, CCM helps individual investors, large & small; achieve improved investment results via independent research and globally diversified investment portfolios. Since we are a fee-based firm, our only objective is to help you protect and grow your assets. Our long-term, theme-oriented, buy-and-hold approach allows for portfolio rebalancing from time to time to adjust to new opportunities or changing market conditions. When looking at money managers in Atlanta, take a hard look at CCM.
All material presented herein is believed to be reliable but we cannot attest to its accuracy. Investment recommendations may change and readers are urged to check with their investment counselors and tax advisors before making any investment decisions. Opinions expressed in these reports may change without prior notice. This memorandum is based on information available to the public. No representation is made that it is accurate or complete. This memorandum is not an offer to buy or sell or a solicitation of an offer to buy or sell the securities mentioned. The investments discussed or recommended in this report may be unsuitable for investors depending on their specific investment objectives and financial position. Past performance is not necessarily a guide to future performance. The price or value of the investments to which this report relates, either directly or indirectly, may fall or rise against the interest of investors. All prices and yields contained in this report are subject to change without notice. This information is based on hypothetical assumptions and is intended for illustrative purposes only. THERE ARE NO WARRANTIES, EXPRESSED OR IMPLIED, AS TO ACCURACY, COMPLETENESS, OR RESULTS OBTAINED FROM ANY INFORMATION CONTAINED IN THIS ARTICLE. PAST PERFORMANCE DOES NOT GUARANTEE FUTURE RESULTS.
Chris Ciovacco Archive |
© 2005-2022 http://www.MarketOracle.co.uk - The Market Oracle is a FREE Daily Financial Markets Analysis & Forecasting online publication.


