Falling Standard of Living for Average American's, Debt/Income/Productivity
Economics / US Debt Apr 17, 2012 - 01:54 AM GMTBy: John_Mauldin
 Lacy Hunt kicks things off with a bang in Hoisington's Quarterly Review and Outlook, this week's Outside the Box:
"The standard of living of the average American continues to fall."
The reason, in a word: debt. Lacy explains what happens:
"Efforts by fiscal and monetary authorities to sustain growth by further debt accumulation may produce some short-term benefit. Sadly, these interludes fade quickly as the debt becomes more destabilizing. The net result of increased indebtedness then becomes the opposite of what policymakers intend when they promote economic growth by either borrowing funds for increased government expenditures or encourage consumers to borrow with artificial and temporary incentives."
In other words, you can't get to real, sustained growth of an economy by growing debt after a certain point –one that, sadly, we have already reached.
It gets worse, because, since 2009, private debt-to-GDP has fallen while government debt-to-GDP has surged. And, as Lacy notes, "United States government spending carries a zero expenditure multiplier, as do operating expenditures of state and local governments. Thus, each dollar spent by the federal government creates no sustainable income, yet the interest payment incurred with each borrowed dollar creates a subtraction from future revenue streams of the private sector."
That is, unproductive government debt is killing us. So what gives? It's simple: we either make some big, tough collective decisions, and make them soon; or we come to the "bang point" documented by Reinhart and Rogoff, where the bond market no longer believes the US will pay its bills. Europe and Japan will get there before we do, but the writing is on the wall: we must get our national-deficit act together.
I am doing a road show for Bloomberg in San Francisco, with 8 meetings today and a few more tomorrow. Bloomberg is marketing a very high-end new service called Mauldin Research Trades. My partners Gary Habib and Peter Mauthe have assembled an all-star team of technical trading analysts (who between them have written about 20 books on technical trading), who give us "conviction" trades each and every week. We publish the letter on Sunday evening. I am very pleased with the results so far. If you are interested, contact your Bloomberg Tradebook representative or drop me a note and we will get them in touch with you.
Tonight is dinner with real estate maven John Burns, where I am sure I will pick up a few new insights (I always do with John). Then I'm off to north of Denver for a day, then back home before I fly down to Austin over the weekend to be with Lacy Hunt at his long-delayed wedding reception where the iconic Texas band Asleep at the Wheel will be playing. Lots of friends there at a must-not-miss evening.
And Join me next Tuesday morning in Philadelphia at The 30th Annual Monetary & Trade Conference: Demographics, Politics, and Economic Growth, sponsored by the Global Interdependence Center (click on program title to register). It will be very informative.
Have a great week! I see some great food and conversation in my life in the next few hours.
Your worried about ever more debt analyst,
John Mauldin, Editor
Outside the Box
JohnMauldin@2000wave.com
Hoisington First-Quarter Review and Outlook
Lacy Hunt and Van Hoisington
Hoisington Investment Management Company
Debt/Income/Productivity
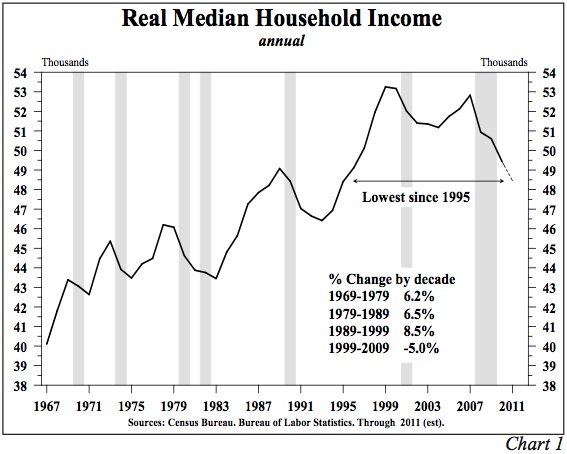
The standard of living of the average American continues to fall. Real median household income today is near the same level as it was fifteen years ago, a remarkable statistic since the debt to GDP ratio is 100 points higher (Chart 1). The cause of this deterioration in living standards can be traced to the excessive accumulation of debt, as well as the debt proportion that has turned increasingly unproductive, or even counterproductive. When debt is utilized to finance nonproductive assets, an economic process is initiated that undermines prosperity. Productivity gains must be generated in order to boost income, and thereby the standard of living. If debt enhances productivity, incomes will expand and the economic pie will be enlarged. Otherwise, the debt increase exercise is debilitating to economic growth.
The negative feedback loop arising from the unproductive nature of this debt accumulation is straightforward. First, United States government spending carries a zero expenditure multiplier, as do operating expenditures of state and local governments. Thus, each dollar spent by the federal government creates no sustainable income, yet the interest payment incurred with each borrowed dollar creates a subtraction from future revenue streams of the private sector. Second, much of the massive debt increase over the past decade has been in the form of mortgage debt. Jobs and income were created with the expansion of the housing stock. However, no productivity gains are evident in this housing stock increase, which means future incomes have not expanded. Nevertheless, the repayment of principal and interest weighs down the system, and the consequences of delinquency, foreclosure, default and bankruptcy compound the problem.
Third, debt that is utilized to finance consumers' daily needs obviously fails to generate any productivity or future income growth. Efforts by fiscal and monetary authorities to sustain growth by further debt accumulation may produce some short-term benefit. Sadly, these interludes fade quickly as the debt becomes more destabilizing. The net result of increased indebtedness then becomes the opposite of what policymakers intend when they promote economic growth by either borrowing funds for increased government expenditures or encourage consumers to borrow with artificial and temporary incentives.
Modern Example of Over-Indebtedness
Since 1989, Japan has provided an excellent but highly disturbing example of the debilitating effects of a prolonged period of taking on additional debt while shifting more of the debt into unproductive uses. In 1989, their public and private debt was just under 400% of GDP. After repeatedly trying all of the Keynesian and monetary school recommendations on a large scale, Japan's debt ratio stood at an all-time record 491% in 2011. Over this 23-year span, the portion of government debt to GDP ratio more than quadrupled, advancing from near 50% to over 200%. The government's financing needs were so great that the private debt to GDP ratio actually contracted nearly 55%, a strong indication that the composition of the debt increasingly financed unproductive activities. Since 1990, numerous episodes of seemingly better Japanese growth failed to establish a self-sustaining recovery as debt's negative feedback loops progressively worsened.
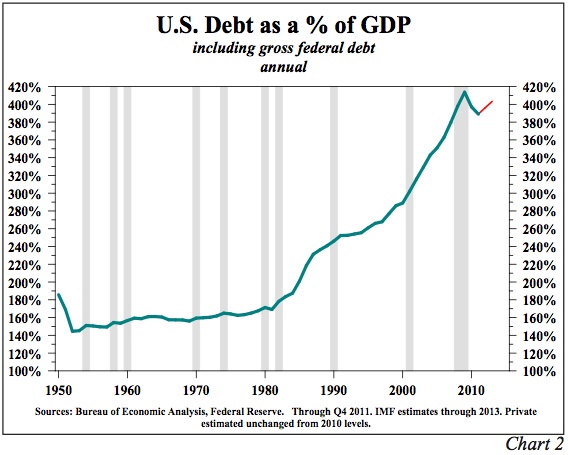
The trajectory of the Japanese experience is beginning to take shape in the United States. Since 2009, private debt to GDP has declined while government debt to GDP has surged. If we use the IMF projections for gross U.S. federal debt for this year and next, and assume that the private debt ratio is stable, the total debt to GDP ratio will rise sharply this year, and again in 2013, putting the U.S. in Japan's footsteps (Chart 2). Also, the U.S. economy has witnessed episodic improvement along with gains in business and consumer confidence. But, ephemeral positive shifts in psychology cannot match the negative elements of higher levels of unproductive debt.
Previous Debt Episodes
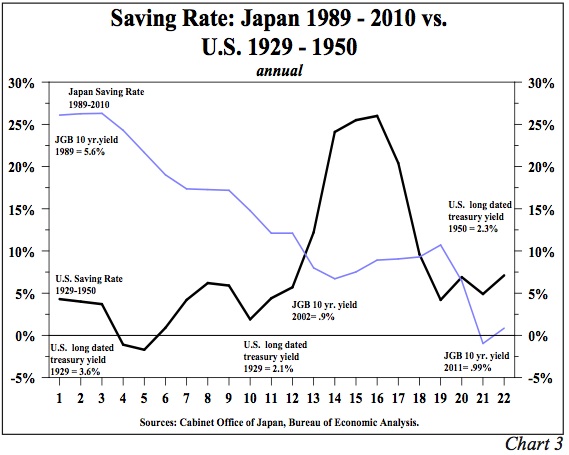
The U.S. accumulated a massive amount of unproductive debt in the 1920s. The ultimate solution to that episode was a period of austerity in which the saving rate soared. Significantly, the Japanese personal saving rate from 1989 to 2010 exhibits a completely contradictory pattern to the U.S. experience from 1929 to 1950. During that period in the United States, the excessive debt of the 1920s was dramatically reduced and created the basis for post WWII U.S. prosperity (Chart 3). From 1989 until the early 1990s, the Japanese saving rate was consistently above 25%, but in recent years it has fluctuated around zero as the debilitating effects of ever high debt levels have accumulated. The mandatory rationing in the United States during World War II, combined with the income generated gains in exports of virtually everything we could produce from U.S. farms, mines and factories pushed the U.S. personal saving to a peak of more than 25%. This permitted the excessive debt of the 1920s to be paid down. The current low level of U.S. saving precludes the same resolution to the debt problem seen in the 1920s case, but is similar to the current Japanese situation.
Bang Point
There is a longer-term negative feedback loop that has been referred to as the "bang point" by economists Reinhart and Rogoff, and it occurs when government or private borrowers are denied access to further credit because the marketplace has no confidence that new or existing debt can be repaid. At this point interest rates soar and debt issuance becomes impractical; therefore, the government or private borrower is forced to live on current revenues. As recent cases in Europe have documented, this is painfully disruptive, with high social costs. We do not believe this point is at hand for the United States, but it has occurred many times historically, including in contemporary Europe. If it were to happen in the U.S. now, the consequences would be traumatic since 42 cents of every dollar spent by the federal government in the first six months of the current fiscal year was borrowed. The chaos that would be created by a reduction in federal government spending of 42% is unimaginable.
Disequilibrium
Economic models, regardless of whether from micro or macroeconomics have two conditions: equilibrium and transition. In the simplest micro model like the market for soft drinks, equilibrium is reached when the supply and demand curves intersect and determine the price of the item and the quantity demanded and supplied. When either the demand or supply curves shift, this transition leads to a new equilibrium. Equilibrium occurs at a specific point in time. This simple model also yields total dollar sales or the quantity supplied or demanded, multiplied by the selling price. When aggregate demand and supply curves intersect, the aggregate price level, real GDP and nominal GDP are determined at a specific point in time.
The economics profession has almost universally taught that equilibrium is the main condition and that transition is short and largely trivial. Little effort is made to trace the critical role of the transition process. However, the sweep of economic data over the last hundred years suggests that transition is a much longer phase than equilibrium. Economies only attain equilibrium briefly, if at all, before moving on to another period of transition.
Tracking Debt Disequilibrium
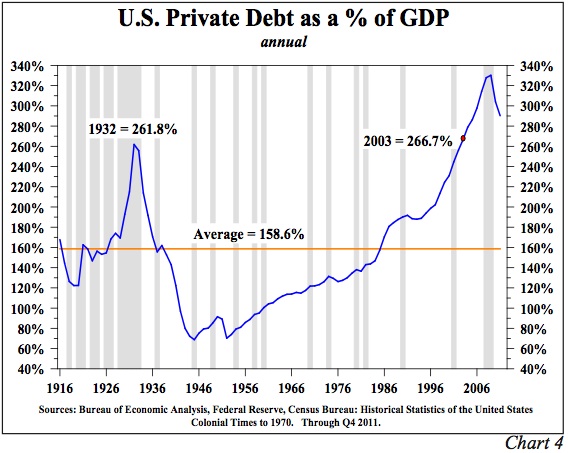
The distinction between equilibrium and transition is well illustrated by the private debt statistics available since 1916. Over this 96-year span, private debt to GDP averaged close to 160%, or 130% below the level for 2011. The private debt to GDP ratio moved into close proximity or crossed its mean no more than ten times (Chart 4). Obviously much more time has been spent in transition than at equilibrium. A similar economic indicator, velocity of money, demonstrates the same pattern.
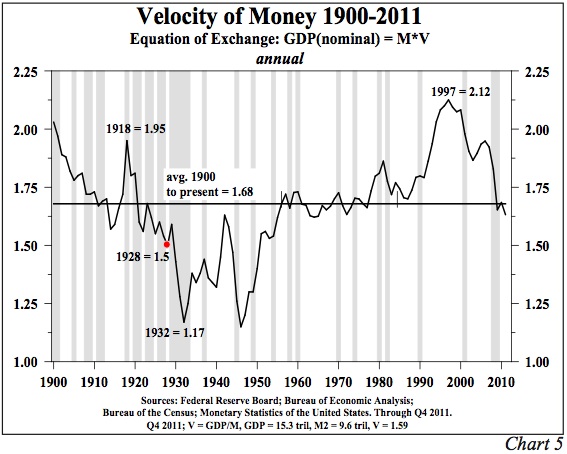
The velocity of M2 (V2) had only ten equilibrium points from 1900 to 1953 and from 1980 to the present. From 1953 to 1980, V2 was stable around the post 1900 mean of 1.68 (Chart 5). Periods of stability should not be surprising since debt and velocity are linked. When increases in debt are of the sound variety, such as the normal type of business and consumer lending in traditional banking, velocity should be stable. When debt to GDP accelerated very rapidly after 1980 along with a great increase in financial innovation, velocity surged until hitting a post 1900 peak of 2.12 in 1997. After 1997, velocity turned down, indicating the surge in debt was going into less productive uses. Such a pattern was exhibited in the 1920s when the debt to GDP ratio surged, but V2 fell. Other series with very long historical records, like the price earnings (P/E) ratio, the cyclically adjusted P/E ratio and the real 30-year Treasury bond yield, confirm that equilibrium is the rare condition. Transition is the norm, and that transition is extremely volatile and erratic.
In 2011, the U.S. private and public debt to GDP ratio was about 174 percentage points higher than the post 1870 average. Comparably measured debt to GDP ratios are substantially higher in the Euro zone, the UK, Japan and even Canada, indicating that the debt issue is a global depressant to growth. To remove this growth impediment, debt needs to decline dramatically relative to GDP for a prolonged period. Contrary to common wisdom, monetary and fiscal policy actions that spur growth by increasing debt may buy transitory gains in some measures of economic activity, but they perpetuate this disequilibrium. Increasing debt merely makes the economy more vulnerable to economic weakness and potential instability because income growth is stunted or, as previously stated, over-indebtedness cannot be cured by more debt. Periods of over-indebtedness change the sacrosanct rules of thumb of business cycles. The conventional wisdom of business cycle analysis that suggests five to seven good years followed by one to two bad years is broken. Normal risk taking is not rewarded.
Impact on Investment Returns
The current period of extreme indebtedness in the U.S. constitutes the third such episode since the Civil War. The two earlier cases include the 1860s and early 1870s, and the 1920s and 1930s. After these previous massive debt buildups, two twenty-year periods ensued where the total return on the S&P500 was less than the total return on long-term Treasury bonds, a condition referred to as a negative risk premium. The underperformance of stocks relative to bonds from 1928 to 1948 occurred even though WWII intervened. Extreme over-indebtedness created a different playing field from normal circumstances that did not reward risk for a very long time. Once the excessive indebtedness was corrected, a positive risk premium was reestablished. The risk premium was also negative from 1991 to 2011.
Thus, if the U.S. economy is unable to deleverage, then the already long cycle of an abnormal, or negative, risk premium will be extended. A negatively correlated asset, such as long-term Treasury bonds, will continue to generate positive returns, while serving to minimize the volatility in a diversified portfolio.
The Pathway Out of Excessive Indebtedness
From both economic theory and historical experience the answer is clear; austerity is the solution to too much debt. McKinsey Global Institute examined 32 cases where extreme leverage caused financial crises since the 1930s. In 24, or 75% of these cases austerity was required, which McKinsey defines as a multi-year and sustained increase in the saving rate. Public and/or private borrowers took on too much debt because they lived beyond their means, or they consumed more than they earned. Thus, to reverse the problem spending had to be held below income, increasing the saving rate. In eight, or 25% of these McKinsey cases the problem was solved by high inflation, but none were major global economies and all were emerging markets with either no central bank or a very weak one. It should be noted that some of these cases involved massive currency devaluations, an option that is not open to the United States or the other major highly indebted economic powers.
Devaluations were tried repeatedly from the late 1920s until World War II during an episode referred to as "beggar thy nation" policies. These devaluations only produced temporary gains for individual countries because retaliatory devaluations ensued. In those days, the world was on the gold standard, so it was possible to devalue, whereas today all major currencies except the Chinese Yuan float freely, or relatively so. That period was before the world understood the Nash Equilibrium, named for the Nobel Prize winning economist John Forbes Nash. Nash's equations demonstrate that if one party takes an action unilaterally for its own benefit then the overall benefit to all parties will decline.
Many people, including the majority in the political arena, consider austerity to be an unpalatable option. The Japanese policy makers have rejected this solution for more than two decades as their saving rate has declined from almost 25% to nearly zero. But, if the McKinsey data and economic theory are as valid as we believe, then the sooner the reality is accepted the sooner the economic norm can be restored. Taking on more debt, the current course of action, only serves to delay the restoration of prosperity. In other words, more debt can boost the GDP growth rate for a short period of time, but the GDP growth rate cannot remain elevated, and increased indebtedness serves to further undermine the standard of living.
Inflating Away Debt
Even though history demonstrates that inflating away debt has occurred only in small nations with unusual circumstances, this option remains a point of concern in the United States. We continue to believe that a deflationary environment is more likely to prevail than an inflationary one for several reasons. First, attempting to create higher inflation would mean that our debt to GDP ratio would only grow more onerous. In the U.S., debt is about four times the size of GDP. The increase in interest rates associated with higher inflation would be one for one according to well-tested empirical results and economic theory. However, GDP would lag because real incomes would fall short as the cost of living would rise faster than income for most Americans. Demand for higher wages might prevail in time but full relief would be lacking for a broad section of employees. In addition, a downward bias on wages would exist from import competition. Second, the rising rate structure would decimate discretionary expenditures at all levels of government. Deficits would increase as the interest on the debt would be increasing faster than revenues, and would replace all discretionary expenditures in a very short period. At the end of the day, more debt and increased interest payments would translate into lower productivity, lower income, and higher unemployment. To start down this road of inflation would be foolish, impractical, and improbable.
Bond Yield Developments
In early April the Fed announced that there were no plans to embark on a new round of quantitative easing. Initially, the announcement was greeted negatively in the Treasury bond market, as evidenced by rising yields. Our analysis indicates that the Fed's decision should be viewed ultimately as a constructive development. The ending of QE1 and QE2 caused investors to shift from inflationary sensitive assets into longer-dated Treasury securities as the economy slowed, and inflation quickly subsided once the Fed's balance sheet stabilized. This prior experience indicates that the current upturn in inflation and the related rise in bond yields is likewise transitory.
Since the end of last quarter, the 30 year Treasury bond yield has risen to a high of 3.5% in March. In most years economic optimism seems to flourish for the first four or five months of the year. Seasonally, interest rates are usually at their yearly highs between late February and mid May. In fact, in fourteen of the last twenty years the thirty-year Treasury bond yield has peaked in the first half of the year. Our view remains that while interest rates can rise for many transitory reasons, underlying economic fundamentals suggest long-term rates cannot remain elevated and will gradually move lower.
By John F. Mauldin
Outside the Box is a free weekly economic e-letter by best-selling author and renowned financial expert, John Mauldin. You can learn more and get your free subscription by visiting www.JohnMauldin.com.
Please write to johnmauldin@2000wave.com to inform us of any reproductions, including when and where copy will be reproduced. You must keep the letter intact, from introduction to disclaimers. If you would like to quote brief portions only, please reference www.JohnMauldin.com.
John Mauldin, Best-Selling author and recognized financial expert, is also editor of the free Thoughts From the Frontline that goes to over 1 million readers each week. For more information on John or his FREE weekly economic letter go to: http://www.frontlinethoughts.com/
To subscribe to John Mauldin's E-Letter please click here:http://www.frontlinethoughts.com/subscribe.asp
Copyright 2012 John Mauldin. All Rights Reserved
Note: John Mauldin is the President of Millennium Wave Advisors, LLC (MWA), which is an investment advisory firm registered with multiple states. John Mauldin is a registered representative of Millennium Wave Securities, LLC, (MWS), an FINRA registered broker-dealer. MWS is also a Commodity Pool Operator (CPO) and a Commodity Trading Advisor (CTA) registered with the CFTC, as well as an Introducing Broker (IB). Millennium Wave Investments is a dba of MWA LLC and MWS LLC. Millennium Wave Investments cooperates in the consulting on and marketing of private investment offerings with other independent firms such as Altegris Investments; Absolute Return Partners, LLP; Plexus Asset Management; Fynn Capital; and Nicola Wealth Management. Funds recommended by Mauldin may pay a portion of their fees to these independent firms, who will share 1/3 of those fees with MWS and thus with Mauldin. Any views expressed herein are provided for information purposes only and should not be construed in any way as an offer, an endorsement, or inducement to invest with any CTA, fund, or program mentioned here or elsewhere. Before seeking any advisor's services or making an investment in a fund, investors must read and examine thoroughly the respective disclosure document or offering memorandum. Since these firms and Mauldin receive fees from the funds they recommend/market, they only recommend/market products with which they have been able to negotiate fee arrangements.
Opinions expressed in these reports may change without prior notice. John Mauldin and/or the staffs at Millennium Wave Advisors, LLC and InvestorsInsight Publishing, Inc. ("InvestorsInsight") may or may not have investments in any funds cited above.
Disclaimer PAST RESULTS ARE NOT INDICATIVE OF FUTURE RESULTS. THERE IS RISK OF LOSS AS WELL AS THE OPPORTUNITY FOR GAIN WHEN INVESTING IN MANAGED FUNDS. WHEN CONSIDERING ALTERNATIVE INVESTMENTS, INCLUDING HEDGE FUNDS, YOU SHOULD CONSIDER VARIOUS RISKS INCLUDING THE FACT THAT SOME PRODUCTS: OFTEN ENGAGE IN LEVERAGING AND OTHER SPECULATIVE INVESTMENT PRACTICES THAT MAY INCREASE THE RISK OF INVESTMENT LOSS, CAN BE ILLIQUID, ARE NOT REQUIRED TO PROVIDE PERIODIC PRICING OR VALUATION INFORMATION TO INVESTORS, MAY INVOLVE COMPLEX TAX STRUCTURES AND DELAYS IN DISTRIBUTING IMPORTANT TAX INFORMATION, ARE NOT SUBJECT TO THE SAME REGULATORY REQUIREMENTS AS MUTUAL FUNDS, OFTEN CHARGE HIGH FEES, AND IN MANY CASES THE UNDERLYING INVESTMENTS ARE NOT TRANSPARENT AND ARE KNOWN ONLY TO THE INVESTMENT MANAGER.
John Mauldin Archive |
© 2005-2022 http://www.MarketOracle.co.uk - The Market Oracle is a FREE Daily Financial Markets Analysis & Forecasting online publication.


