The Stock Market, Sunspots and Geomagnetism
Stock-Markets / Stock Markets 2012 Mar 07, 2012 - 10:22 AM GMTBy: John_Hampson
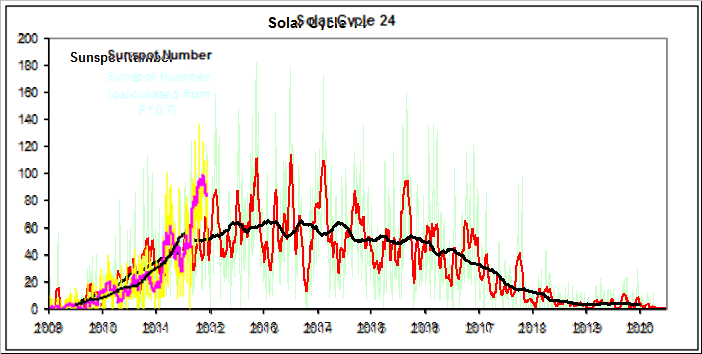
 The solar peak is forecast for February/March 2013, which means sunspot counts should peak around then. The chart below shows that sunspots picked up from their December 2008 minimum gradually, becoming significant in 2011. In the last few months though, they appear to have died away.

This does not mean the solar cycle has peaked early, but reflects the oscillations of sunspot levels around a trend. Below is an overlay of this solar cycle (24) into the end of 2011 on top of solar cycle 14, which was a ‘spikey’ cycle. Less powerful solar cycles, such as both of these, are typically more spikey.

Source: SolarHam
It follows then, that we should expect an up-cycle of sunspots now, lasting perhaps several months, and if we zone in on a smaller timescale, we see evidence that this is perhaps now beginning, with a sudden increase in the last few days.

We can see from the above chart that sunspots rallied last year between February and November, or perhaps in two distinct upswings of February-April and September-November.
I have just produced a 26 page PDF on my new IN DEPTH GUIDE page which explains the relations between solar cycles and the financial markets in detail, so here I’ll just summarise that rising sunspots correlate with (i) earthquakes (ii) protest, revolution and war (iii) pro-risk and inflation.
The 7 most major earthquakes of 2011 all occurred in the two windows of Feb-Mar and Sept-Nov, corresponding to the upswings in sunspots. The Arab Spring revolutions main events began with the Tunisian overthrow in January and ending in the Libyan war finishing in October, again corresponding to the overall period of rising sunspots. And lastly, both significant inflation and outperformance in gold lasted between January and September, again tying in with the sunspot rally.
So, if sunspot counts begin to accelerate now and rise to new heights over the next few months (which we should expect as we are getting nearer to the solar peak), we should be alert for (i) earthquakes (ii) protest, revolution and war (e.g. Iran) and (iii) pro-risk and inflation, namely commodities rising and in turn inflation. Clearly (ii) could impact (iii) as oil could rise on supply jeopardy and gold as security.
As yet, we still do not see outperformance in commodities versus stocks, but at some point soon this should begin to occur, as by solar cycles a secular peak in commodities should occur in 2013. The chart below shows how stocks outfperformed commodies into their secular of March 2000, breaking away from their usual combined risk-on relations, and we should expect something similar from commodities into 2013.

Now turning to geomagnetism, we see a pick up in both actual and forecast geomagnetism that reflects the historic seasonality of geomagnetism, that typically is at a maximum in March and April. This negatively affects sentiment, and therefore we see in the models for stocks and commodities some short term downward pressure.


If we look at the medum term view we can see a clear flattening out and tipping over of the model:

This means headwinds for pro-risk until geomagnetism begins to ebb again, which by historic seasonality would be May-time.
This appears contradictory - rising sunspots ahead supportive of pro-risk, but significant geomagnetism ahead anti-risk. To further complicate things, rising sunspots typically lead to higher episodes of geomagnetism (though a lag can be common). A simplistic analogy would be that some alchohol (solar activity) makes for human excitability, but too much can also make for a lagged hangover (geomagnetism).
Returning to the chart above that shows stocks accelerating away from 1998-2000 in their secular mania finale, stocks actually took off from the geomagnetism model in this period, as might be expected in ‘irrational exuberance’. We should see the same therefore in commodities this time round into 2013. What I suggest could happen therefore, is that from amongst protests, revolution, war and earthquakes, we get a sunspot-inspired supply/security push on commodities, and a sunspot-inspired pro-risk/inflationary flow into commodity demand, which takes commodities above and away from the geomagnetism model, whilst stocks remain on the geomagnetism model track of sideways peformance. In other words, if a commodities secular finale is ahead, completing in 2013 (as solar cycles history predicts), then the period ahead is a window in which commodities should start to outperform.
John Hampson, UK / Self-taught global macro trader since 2004
www.solarcycles.net (formerly Amalgamator.co.uk) / Predicting The Financial Markets With The Sun
© 2012 Copyright John Hampson - All Rights Reserved Disclaimer: The above is a matter of opinion provided for general information purposes only and is not intended as investment advice. Information and analysis above are derived from sources and utilising methods believed to be reliable, but we cannot accept responsibility for any losses you may incur as a result of this analysis. Individuals should consult with their personal financial advisors.
© 2005-2022 http://www.MarketOracle.co.uk - The Market Oracle is a FREE Daily Financial Markets Analysis & Forecasting online publication.


