Stock Market Update: Trading the Deceptive Triangle Bounce
Stock-Markets / US Stock Markets Jan 13, 2008 - 07:54 AM GMTBy: Dominick
 I can't go publicly posting the charts members pay for, but I can say that, as an example, as the weekly update was being posted here last Saturday, TTC members, whether scalpers, swing traders or position traders, were all receiving several forward looking charts describing the big picture and laying out our plans for the days ahead. The chart below was such a one, showing the triangle that the concurrent update said “many traders see.” Well, the market rarely if ever gives the crowd what they're expecting. The chart above from the Saturday weekly forum shows our immediate expectation for a deceptive bounce that would have as many as possible trading the triangle only to reverse them down into the lower trendline.
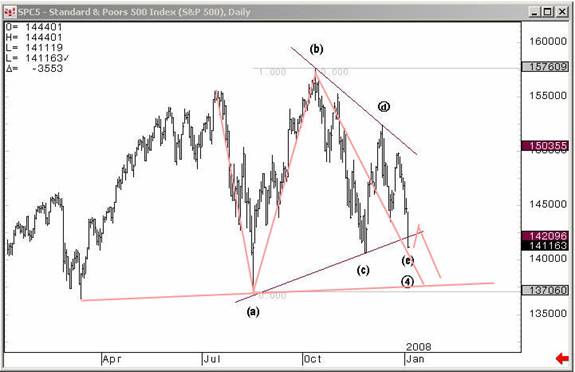
I can't go publicly posting the charts members pay for, but I can say that, as an example, as the weekly update was being posted here last Saturday, TTC members, whether scalpers, swing traders or position traders, were all receiving several forward looking charts describing the big picture and laying out our plans for the days ahead. The chart above was such a one, showing the triangle that the concurrent update said “many traders see.” Well, the market rarely if ever gives the crowd what they're expecting. The chart above from the Saturday weekly forum shows our immediate expectation for a deceptive bounce that would have as many as possible trading the triangle only to reverse them down into the lower trendline.
This week's charts are already posted and I show how the current analysis signals that we might be at one of the most important decision points of the year! Take advantage of the offer below.
Meanwhile, recall that last week's update said: “ We're keeping an eye on charts and indicators that, believe it or not, say this move to the downside is at or near its limit, at least for a tradable bounce. And this is what it means to separate trade from analysis: the bears have been right so far this year, and the trend may continue to be downward for months, but that doesn't mean now is the time to get short if the next move is higher. Support that's waiting at or below current levels makes us tend to think the market probably does not immediately collapse from here.”
Monday morning did in fact open with a gap higher that dramatically sold off, but didn't crash. In all, the market closed roughly flat, but after 75 points of intraday movement, a smorgasbord for traders! And the irony is that, as most were probably pulling their hair out, the trades get simpler and simpler as more basic ideas tend to work for small timeframes in highly volatile markets. Finding the trendline in the chart above wasn't particularly difficult if you knew where to look for it and, having it in advance, it's easy to trade it – easy at least compared to trying to take a position based on real time news or economic analysis!
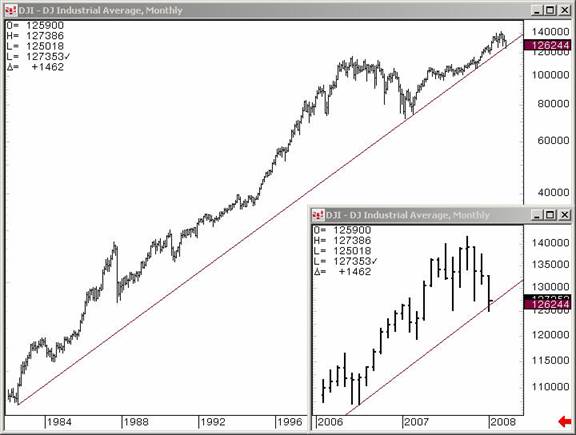
Instead of giving into the fear that gripped the street this week, we went in anticipating buying support. Last week's update even showed a twenty-five year trendline in the Dow, updated above, that, when it showed signs of holding early and midweek, helped assure us in buying the lows.
The chart immediately above shows the NYSE bouncing last Wednesday off a perfect 1x1 measured move. Again not rocket science, and though an analyst could paint a bearish picture with this chart for the bigger picture, having the correct line still makes an effective short term trade and makes real money.
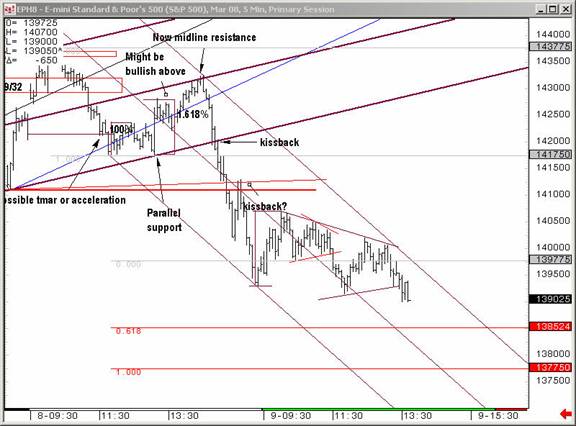
The chart below is a bit more technical, mapping a variety of intraday trades also from Wednesday. Posted shortly before two o'clock , this one finally shows us monitoring 1385 as an obvious potential support, a level that shortly thereafter became the exact low of the day.
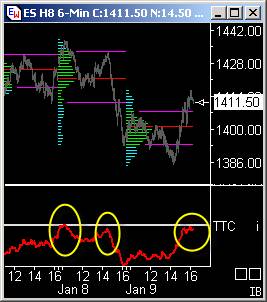
Another factor keeping the week manageable and profitable this week was our several proprietary indicators, but particularly our “Change of Trend” indicator, pictured below. As you can see, this kept us in the game by having us sell each swing high as it approached the change in trend line. We were compelled to sell, even when we felt a short term low was in place, because we knew we could always get in a few points higher if the change in trend occurred. The chart here explains our decision to sell into Wednesday's close, a move ultimately justified by Thursday's opening about ten points lower.
I get lots of curious readers asking if I send out email alerts or make calls for buys or sells. Clearly we stay busy, but the fact is I do not tell people what to do with their money, largely because there are so many different styles of trading and different time frames and risk tolerances. What we do at TTC is offer counts and charts, virtually around the clock and with this information, members don't need market calls. In other words, the analysis is the call. If you feel you need an email in your inbox telling you what to do, TTC is probably not for you. Instead we offer our members proprietary indicators and targets that allow them to plan and execute their own winning trades.
In addition to the indicators, our numbers hit particularly well this week, having hit the exact low as you've already seen. The chart below shows our targets from that established low to be 1402,1407, 1412, 1430, and 1437.50.
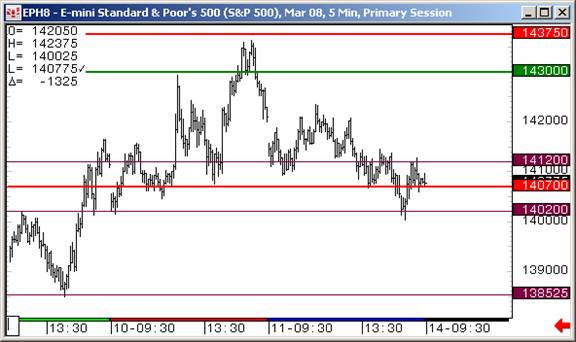
After Thursday's gap down opening, we immediately ramped up above 1407, from the 1402 target, and began consolidating at that level. It was at that time that headlines from Bernanke's pending speech were preemptively leaked to the media and we lifted from 07 directly into our next target area. In retrospect, the media attributed that rally to the Fed chairman's aggressive position, but it was our intention to buy support at that level and the headlines from the as-yet undelivered speech just as the market approached our buying target were a gift that played perfectly into our hands.
Having entered a planned trade we, of course, had a target for the move. On the other hand, those that were taken by surprise, possibly having to cover short positions had to buy as the market was approaching our 1430 target. Actually, the market got as high as 1429.75 before showing resistance, which we sold, and then reversing and heading back down. Seeing 1407 again show signs of being support, and knowing the Fed chairman needed an up day to go with his speech, we got long again having been given a redo of the trade we'd just completed. Our buy coincidentally came just as the news was breaking of Bank of America's purchase of Countrywide Financial, but we were just buying a proven support level. This time the rally moved up to the high of the day at 1436.40, just about a point shy of our ultimate target for the move.
I'm not a fundies guy, and if you want to read more about what Bernanke said and what it could mean for gold, read Joe's Precious Points update. But when the Fed chairman's speech is leaked an hour early and shows up on the tape it underscores what I've told so many: that being a professional trader sometimes doesn't afford you the opportunity to take a break for lunch, let alone the luxury of relying on an email every few days or a free weekly update.
And what's more, going out near the highs of the day on Thursday after bullish Fedspeak and important M&A activity doesn't typically make one get bearish. But, having reached our targets and taking the profits, it was no big surprise for us to see Friday's open back down near 1400. Our numbers continued to hit, but the trading was much more choppy, suggesting the market coiling for a big move. Ending the week just above our important level at 1407, it's obvious how we'll key off that number next week and use all our tools to continue making money in what is for most a frustrating, sideways market.
Though we lifted off the lows, Friday's decline left us in a middle area that could go either way next week, leaving the short term outlook a bit murky. It may be we get a market that wants to grind higher into option expiry, but no matter what, some will continue to either buy and hold or short with reckless abandon, trying to use a particular bullish or bearish bias to turn a big picture economic analysis into a short term position. But over the past six months these folks have gotten run over repeatedly. And so many are exclaiming, “There's gotta be an easier way to make some money in this market!”
Of course there is – it's called unbiased trading. These volatile times are a paradise for traders who, by keeping to simple rules, manage their risk and trade whichever direction the market takes them. And weeks like these are some of the best ever at TTC.
The bearish swing trader, if they'd sold the exact top tick as we happen to have done in October, would currently have a profitable position, but only at about an average of two or three S&P points per day. Meanwhile the market's actual intraday swings are ten or twenty times that much, even if it ultimately ends close to flat, and only unbiased, short term traders are taking advantage of those huge moves. After a rollercoaster of a week, the S&P is only down 15 points for the outright bearish player, even if they sold the top, whereas nimble unbiased traders made far, far more money riding the intraday moves.
That said, I'm asked by lots mutual fund traders, pension account traders and other longer time frame market participants whether a site like TTC could be useful for them. And the answer is yes. I mean, if you were planning a vacation a month away, you'd still check the weather there ahead of time, wouldn't you? Just because you aren't trading the short term wiggles and squiggles doesn't make the additional information any less useful for planning entries and exits for longer term positions. In fact, TTC is ideally configured to allow members with longer time frames to get weekly big-picture information beyond what's available in this update without having to look in the daily forums or real time chatroom. And they also have access to these intraday services should a situation evolve rapidly.
Do you want access to the charts posted in the weekly forum right now? If you feel the resources at TTC could help make you a better trader, don't forget that TTC will be raising its monthly membership fee in February and look to close its doors to retail members sometime in the first half of the year. Institutional traders have become a major part of our membership and we're looking forward to making them our focus. If you're a retail trader/investor the only way to get in on TTC's proprietary targets, indicators, forums and real time chat is to join before the lockout starts, and if you join before February, you can still take advantage of the current low membership fee of $89. Once the doors close to retail members, the only way to get in will be a waiting list that we'll use to accept new members from time to time, perhaps as often as quarterly, but only as often as we're able to accommodate them. Don't get locked out later, join now!
To get you started I will run the refund offer again. . Subscribe by January 30th and stay for 7 days with full access to charts, chat and all TTC member privileges. At the end of your trial, if you're not satisfied, simply send me an email and I'll give you a full refund, no strings attached. It's that simple! There's no better value on the web than TTC and now there's no reason not to check it out for yourself. Click here to register for your free trial!
Have a profitable and safe week trading, and remember:
"Unbiased Elliott Wave works!"
By Dominick
www.tradingthecharts.com
If you've enjoyed this article, signup for Market Updates , our monthly newsletter, and, for more immediate analysis and market reaction, view my work and the charts exchanged between our seasoned traders in TradingtheCharts forum . Continued success has inspired expansion of the “open access to non subscribers” forums, and our Market Advisory members and I have agreed to post our work in these forums periodically. Explore services from Wall Street's best, including Jim Curry, Tim Ords, Glen Neely, Richard Rhodes, Andre Gratian, Bob Carver, Eric Hadik, Chartsedge, Elliott today, Stock Barometer, Harry Boxer, Mike Paulenoff and others. Try them all, subscribe to the ones that suit your style, and accelerate your trading profits! These forums are on the top of the homepage at Trading the Charts. Market analysts are always welcome to contribute to the Forum or newsletter. Email me @ Dominick@tradingthecharts.com if you have any interest.
This update is provided as general information and is not an investment recommendation. TTC accepts no liability whatsoever for any losses resulting from action taken based on the contents of its charts, commentaries, or price data. Securities and commodities markets involve inherent risk and not all positions are suitable for each individual. Check with your licensed financial advisor or broker prior to taking any action.
Dominick Archive |
© 2005-2022 http://www.MarketOracle.co.uk - The Market Oracle is a FREE Daily Financial Markets Analysis & Forecasting online publication.


