


Stock Market Volatility Bounces Bottom Awaiting Bad News or Selling to Strike!
Stock-Markets / Stock Markets 2012 Mar 04, 2012 - 11:51 AM GMTBy: Chris_Vermeulen

 Over the past 5 months we have seen volatility steadily decline as stocks and commodities rise in value. The 65% drop in the volatility index is now trading at a level which has triggered many selloffs in the stock market over the years as investors become more and more comfortable and greedy with rising stock prices.
Looking at the market from a HERD mentality and seeing everyone run to buy more stocks for their portfolio has me on edge. We could see a strong wave of fear/selling hit the S&P 500 Index over the next two weeks catching the masses with their hand in the cookie jar . . . again.
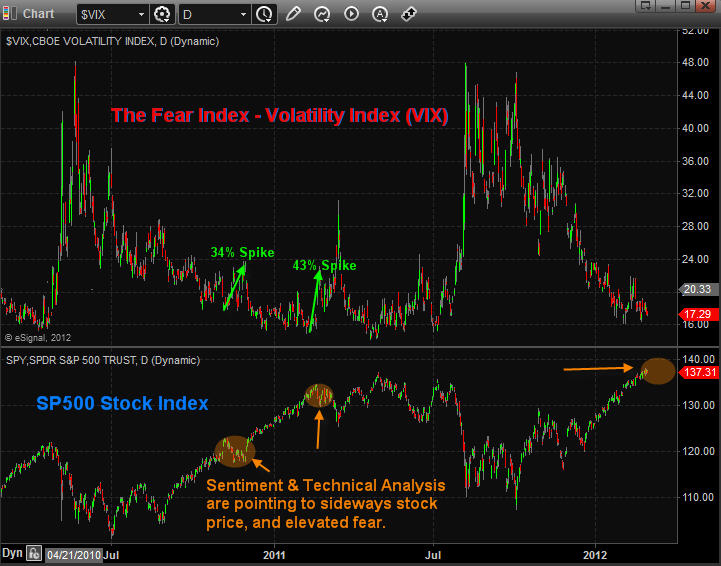
If you don't know what the volatility index (VIX) is, then think of it as the fear index. It tells us how fearful/uncertain investors are or how complacent they are with rising stock prices. Additionally a rising VIX also demonstrates how certain the herd is that higher prices should continue.
The chart below shows this fear index on top with the SP500 index below and the correlation between the two underlying assets. Just remember the phrase "When the VIX is low it's time to GO, When the VIX is high it's time to BUY".
Additionally the Volatility Index prices in fear for the next 30 days so do not be looking at this for big picture analysis. Fear happens very quickly and turns on a dime so it should only be used for short term trading, generally 3-15 days.
Volatility Index and SP500 Correlation & Forecast Daily Chart:
Global Issues Continue To Grow But What Will Spark Global Fear?
Everyone has to admit the stock market has been on fire since the October lows of last year with the S&P 500 Index trading up over 26%. It has been a great run, but is it about to end? Where should investors focus on putting their money? Dividend stocks, bonds, gold, or just sit in cash for the time being??
I may be able to help you figure that out.
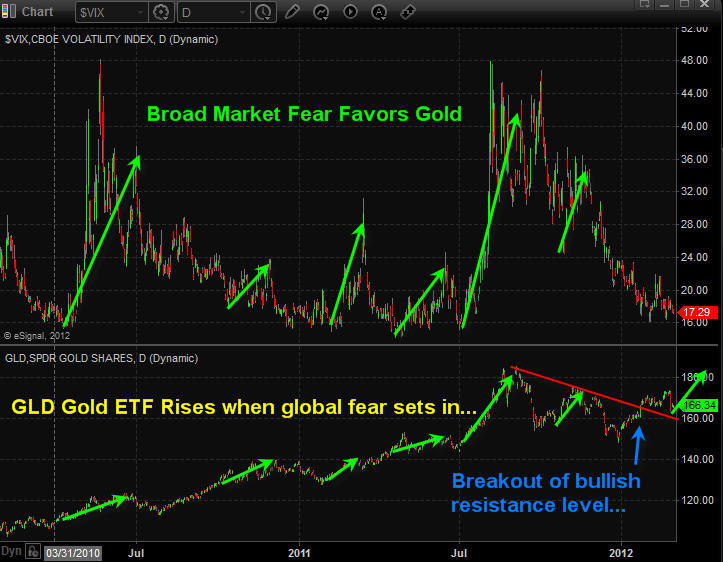
Below is a chart of the Volatility index and the gold exchange traded fund which tracks the price of gold bullion. Notice how when fear is just starting to ramp up gold tends to be a neutral or a little weak but not long after investors start selling their shares of securities we see money flow into the shiny yellow safe haven.
Gold & Fear Go Hand-In-Hand: Daily Chart
Looking at the relationship between investor fear/uncertainty and gold you will notice scared money has a tendency to move out of stocks and into safe havens.
Trading Conclusion Looking Forward 3 months...
In short, I feel the financial markets overall (stocks, commodities, and currencies) are going to start seeing a rise in volatility meaning larger daily swings which inherently increased overall downside risk to portfolios and all open positions.
To give you a really basic example of how risk increases, look at the daily potential risk the SP500 can have during different VIX price levels:
Volatility index under 20.00 Low Risk: Expect up to 1% price gaps at 9:30am ET, and up to 5% corrections from a previous high.
Volatility index between 20 - 30 Medium Risk: Expect up to 2% price gaps at 9:30am ET, and up to 15% corrections from recent market tops or bottoms.
Volatility index over 30 High Risk: Expect 3+% price gaps at 9:30am ET, and possibly another 5-15% correction from the previous VIX reading at Medium Risk
Note on price gaps: If you don't know what I am talking about a price gap is simply the difference between the previous day's close at 4:00pm ET and the opening price at 9:30am ET.
To continue on my market outlook, I feel the stock market will trade sideways or possibly grind higher for the next 1-2 weeks, during this time volatility should trade flat or slightly higher because it is already trading at a historically low level. It is just a matter of time before some bad news hits the market or sellers start to apply pressure and either of these will send the fear index higher.
Get My FREE Weekly Newsletter Here: http://www.GoldAndOilGuy.com/
By Chris Vermeulen
Chris@TheGoldAndOilGuy.com
Please visit my website for more information. http://www.TheGoldAndOilGuy.com
Chris Vermeulen is Founder of the popular trading site TheGoldAndOilGuy.com. There he shares his highly successful, low-risk trading method. For 6 years Chris has been a leader in teaching others to skillfully trade in gold, oil, and silver in both bull and bear markets. Subscribers to his service depend on Chris' uniquely consistent investment opportunities that carry exceptionally low risk and high return.
This article is intended solely for information purposes. The opinions are those of the author only. Please conduct further research and consult your financial advisor before making any investment/trading decision. No responsibility can be accepted for losses that may result as a consequence of trading on the basis of this analysis.
Chris Vermeulen Archive |
© 2005-2022 http://www.MarketOracle.co.uk - The Market Oracle is a FREE Daily Financial Markets Analysis & Forecasting online publication.