


Stock Market Uptrend Top for Potential Extension
Stock-Markets / Stock Markets 2012 Mar 04, 2012 - 01:48 AM GMTBy: Tony_Caldaro

 A consolidation week for the major US indices, as the SPX traded in another narrow range: 1355-1378, but made another new uptrend high. For the week the SPX/DOW were mixed, but the NDX/NAZ were +0.7%. Asian markets gained 0.6%, European markets gained 0.7%, but the DJ World index was -0.1%. Economic reports for the week were mixed: 6 Up and 6 Down. On the downtick: durable goods orders, Case-Shiller, personal income, ISM manufacturing, construction spending and investor sentiment. On the uptick: pending home sales, consumer confidence, Q4 GDP, the Chicago PMI, personal spending, and the WLEI. Overall it was a fairly quiet trendless week after wednesday’s open. Next week: the monthly Payrolls report, Consumer credit and ISM services.
LONG TERM: bull market
While economic indicators dropped to a potential recession in the summer of 2011. Consumer sentiment hit a 30 year low, and the Public allocation of funds was quite bearish. Some six months later, economic indicators have improved, consumer sentiment has turned higher, the public is now less bearish, but all three indicators remain below a neutral 50%. Meanwhile the stock market has risen 28% since the October 2011 low, and remains in a bull market since March 2009.
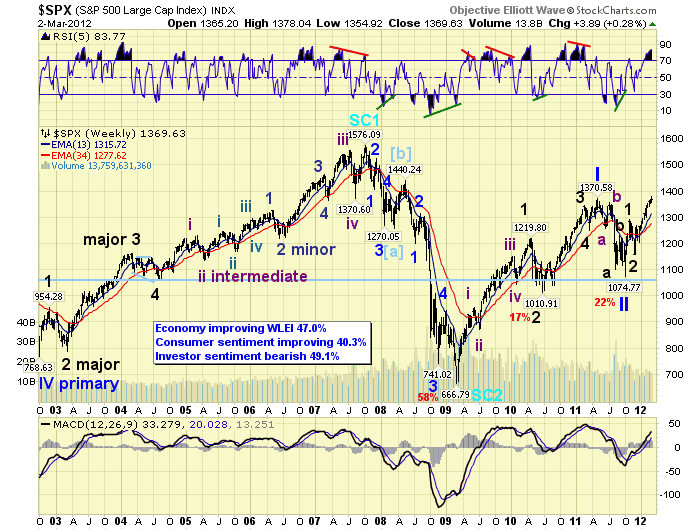
Our weekly chart displays our OEW count and a couple of our technical indicators. Notice the RSI displays our current uptrend is quite overbought, and the MACD is solidly over neutral and rising. These are signs of a bull market unfolding. Our OEW count suggests the market is in Cycle wave [1] of multi-generational Supercycle wave 3. Primary waves I and II have completed, of the five Primary wave bull market, and Primary wave III has been underway since the October 2011 low. With all four US major indices at new bull market highs the bull market scenario continues to be confirmed. Currently we expect this bull market to top out around the October 2007 highs, or higher, by the second half of 2013.
MEDIUM TERM: uptrend high SPX 1378
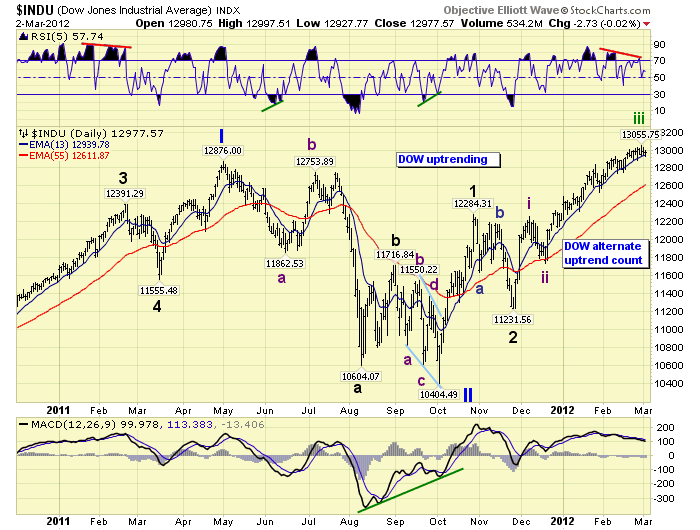
The current uptrend made a new high this week, SPX 1378, as this market continues to rise from the downtrend low at SPX 1159 in late November. While we expected this uptrend to top some time in February, it has had ample opportunity during the past couple of weeks, but it continues to grind higher. This reminds us of two lengthy uptrends during this bull market: Jly09-Jan10 and Jly10-Feb11. Both of those uptrends had plenty of opportunities to correct after three months, but they continued to grind higher, pulled back some, and then extended. This uptrend is beginning to look like the most recent lengthy uptrend: Jly10-Feb11. Then, that uptrend rallied for one month, pulled back, rallied for another three months, pulled back, and then completed its uptrend months later. We will have to consider this an alternate count for now and it will be posted on the DOW charts.
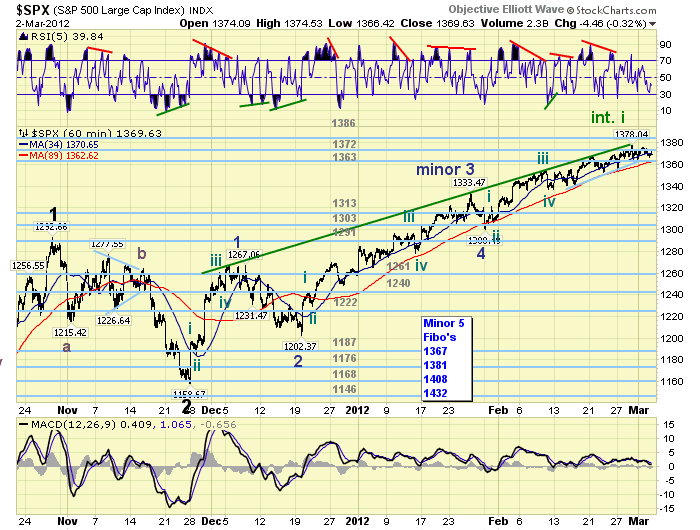
In the meantime we maintain our original count, which suggests the SPX has been in Minor wave 5, of this five wave uptrend, since the 1300 Minor wave 4 low at the end of January. Fibonacci relationships suggest the next level of resistance is at SPX 1381, (Minor 5 = 0.618 Minor 3). Then resistance appears at SPX 1408, (Minor 5 = Minor 1), and SPX 1432, (Minor 5 = Minor 3). Our OEW pivot cluster at 1363, 1372 and 1386 has held this market in check for the last couple of weeks. Should the market exceed the 1386 pivot, (SPX 1394), there is no pivot resisitance until 1440. And, we would be likely looking at a Major wave 3 uptrend then, instead of our current Intermediate wave i uptrend. The DOW charts displays this possibility.
SHORT TERM
Support for the SPX is at the 1363 pivot, then SPX 1355 and 1341. Overhead resistance is at the 1372, 1386 pivots and then SPX 1408. Short term momentum nearly hit oversold on friday then bounced higher. The OEW short term charts remain positive since around SPX 1310.
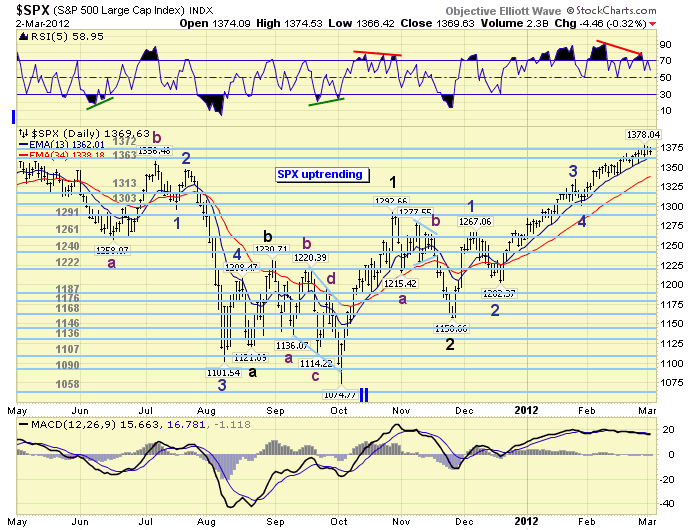
We have been counting this uptrend as Intermediate wave i of Major wave 3 since its beginning. Minor wave 1 was labeled at SPX 1267, Minor 2 at SPX 1202, Minor 3 at SPX 1333, Minor 4 at SPX 1300, and Minor wave 5 underway since then. Since Minor wave 3 was longer than Minor 1, (131 vs 108 points), Minor wave 5 can end at any length. It is currently 78 points, (1300-1378). The wave count within Minor 5 started off quite clean, but after the SPX 1354 high it has become quite choppy.
While the OEW pivot cluster has contained this market for the past couple of weeks. There is also a rising trendline which as contained this uptrend since its beginning. This is posted on the hourly chart. Should the market break through this trendline, and clear the OEW 1386 pivot, an uptrend extension to the OEW 1440 pivot is likely underway. Should the market trade below SPX 1355 a potential dowtrend is underway. Best to your trading!
FOREIGN MARKETS
The Asian markets were mostly higher on the week for a net gain of 0.6%. Only one downtrend confirmed: Indonesia.
The European markets were mostly higher on the week for a net gain of 0.7%. All indices we track remain in uptrends.
The Commodity equity group was mostly higher on the week for a net gain of 0.8%. All indices uptrending here as well.
The DJ World index remains in an uptrend but lost 0.1% on the week.
COMMODITIES
Bonds are currently downtrending but gained 0.1% on the week. 10 YR yields are uptrending but remains range bound between 1.8% and 2.1%.
Crude had a volatile week losing 2.5% after posting a new uptrend high at $110.55.
Gold made a new uptrend high on tuesday at $1793, then dropped to $1688 the following day. For the week it had a 3.5% loss. It certainly appears to be downtrending now with support between $1640 and $1680.
The USD started to rally around mid-week, is close to confirming a new uptrend, and gained 1.3% on the week. The EUR lost 1.9%, and the JPY lost 0.9%.
NEXT WEEK
Monday kicks off another busy week with Factory orders and ISM services at 10:00. On wednesday we have the ADP index and Consumer credit. Then on thursday weekly Jobless claims. On friday the monthly Payrolls report, the Trade deficit and Wholesale inventories. The FED has nothing scheduled ahead of the FOMC meeting on March 13th. The ECB, however, meets this thursday on March 8th. Best to your weekend and week.
CHARTS: http://stockcharts.com/...
http://caldaroew.spaces.live.com
After about 40 years of investing in the markets one learns that the markets are constantly changing, not only in price, but in what drives the markets. In the 1960s, the Nifty Fifty were the leaders of the stock market. In the 1970s, stock selection using Technical Analysis was important, as the market stayed with a trading range for the entire decade. In the 1980s, the market finally broke out of it doldrums, as the DOW broke through 1100 in 1982, and launched the greatest bull market on record.
Sharing is an important aspect of a life. Over 100 people have joined our group, from all walks of life, covering twenty three countries across the globe. It's been the most fun I have ever had in the market. Sharing uncommon knowledge, with investors. In hope of aiding them in finding their financial independence.
Copyright © 2012 Tony Caldaro - All Rights Reserved Disclaimer: The above is a matter of opinion provided for general information purposes only and is not intended as investment advice. Information and analysis above are derived from sources and utilising methods believed to be reliable, but we cannot accept responsibility for any losses you may incur as a result of this analysis. Individuals should consult with their personal financial advisors.
© 2005-2022 http://www.MarketOracle.co.uk - The Market Oracle is a FREE Daily Financial Markets Analysis & Forecasting online publication.