The Fed is Engineering Barack Obama’s Re-Election Campaign
ElectionOracle / US Presidential Election 2012 Feb 07, 2012 - 04:41 AM GMTBy: Gary_Dorsch
 Mitt Romney has just rolled up back to back victories in the Nevada and Florida primaries, and his path to the Republican nomination looks to be inevitable. Republicans are mostly basing their voting decisions upon opinion polls showing Romney has the best chance of defeating President Barack Obama in the Nov 6th presidential election. According to the latest Gallup poll, both Obama and Romney have equal support of 48% of the US-electorate, and if correct, more than a billion dollars worth of campaign and PAC ads will swamp the media outlets, in order to try an influence the decisions of less than 5% of undecided voters.
In his standard stump speech, Romney charges Obama with peddling for votes by spending taxpayer dollars in order to support his re-election. “Over the past three years Barack Obama has been replacing our merit-based society with an entitlement society,” Romney tells his supporters. Indeed, direct government payments to individuals shot up by almost $600-billion, a +32% increase, since the start of the Obama administration in 2009.
A record 49% of Americans live in a household where someone receives at least one type of government subsidy, such as Medicare, food stamps, hosing subsidies, unemployment insurance, school lunch, veterans’ benefits, etc. And 63% of all federal spending this year will consist of checks written to individuals for which the government receives nothing in return, the White House estimates. That’s up from 46% in 1975 and 18% in 1940. At the same time, about half of Americans pay no federal income tax at all. While the Republicans rail against the burgeoning welfare society, they also support corporate welfare for the oil industry, and tens of billions in subsidies for America’s Agricultural farm factories.
Americans are facing tough times. Millions are still out of work. Wages remain stagnant, while health care costs, tuition, and other household cost continue to rise. Many homeowners owe more for their houses than they are worth. Yet the income of the wealthiest 1% of Americans has risen dramatically over the last decade, and now equal 25% of the entire national income. Still, the federal government lavishes the top-1% with billions of dollars in giveaways and tax breaks. Meanwhile 50% of US-workers earned less than $26,364 last year, reflecting a growing income gap between America’s rich and poor.
Undoubtedly, there will be plenty of mudslinging fired from both sides, with political spin artists trying to brainwash the public’s view of the state of the economy. “This president’s misguided policies have made these tough times last longer,” Romney said to his Nevada supporters on Feb 5th. “If elected president, my priority will be worrying about your job, not saving my own,” he added. For his part, Obama told thе Democratic Caucus on January 27th that their votes for the $787-billion economic stimulus package prevented a second Great Depression, and enabled the progress made ѕіnсе the financial crisis of 2008 and 2009. “Over thе last 22-months we’ve seen 3-million jobs сrеаtеd, - and more new factory jobs ѕіnсе thе 1990′s. A lot οf thаt is because of tough decisions уου took,” said Obama.
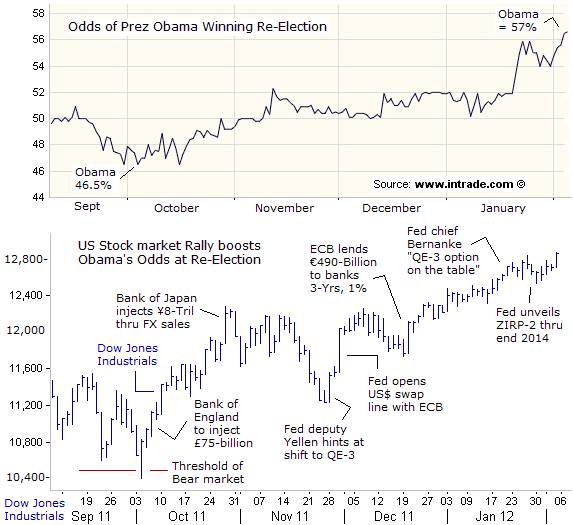
Mitt Romney is now starting to aim most of his fire on President Obama, instead of attacking his Republican rivals. However, Romney’s Road to the White House faces a very big roadblock, - the Federal Reserve. The highly secretive central bank is working around the clock in order to help Mr Obama get re-elected, and the fruits of its labor are just beginning to sprout in the political arena. The Fed has engineered an improbable recovery rally in the stock market that has lifted the Dow Jones Industrials to its highest closing level since May 2008, - back to the time before Lehman Brothers collapsed. The Nasdaq, dominated by technology stocks, has rebounded to the 2905-level, its highest close in 11-years, led by juggernaut Apple Inc.
Despite all of the turmoil in the stock markets over the past five-years, when retail investors withdrew $465-billion of their savings out of stock mutual funds, Fed chief Ben “Bubbles” Bernanke proved that the Fed could rig the stock market, - and engineer an economic recovery by printing vast quantities of money, and keeping interest rates locked at historically low levels. Behind the scenes, the Fed funneled trillions in loans to Wall Street bankers, arranged currency swaps with other central banks, and through in agents, intervened directly in the futures markets, in order to keep the stock market’s recovery rally intact.
One of the Fed’s favorite tools used to pump-up the stock market is “open mouth” operations, in order to influence trader behavior and market psychology. The Fed broadcasts a constant barrage of hints to the financial media, that it could unleash another tsunami of “quantitative easing” (QE), at a moments’ notice. By flooding the markets with ultra-cheap liquidity, the Fed whets the appetite of risk takers, and starts an orgy of speculation in the markets and creates asset bubbles. In turn, a steadily rising stock market is boosting the odds of Obama’s winning a second term. Mirroring the steady climb of the Dow Jones Industrials, online bettors at Inntrade.com, now give Obama a 57% chance of getting re-elected.
That’s up from 46.5% odds of winning on October 4th, when the Dow was plunging in a downward spiral to the 10,500-level. Thanks to massive intervention in the futures market, the Fed put a brutal squeeze on short sellers, and engineered a stunning +374-point rally in the Dow Industrials in the final 45-minutes of trading on October 4th. The Fed turned back the threat of a Bear market, and in hindsight, ignited the third leg up for the Bull market that began in March 2009. The Fed has proved its ability to manhandle the Treasury bond and stock markets, and few traders are willing to fight the Bernanke Fed these days.
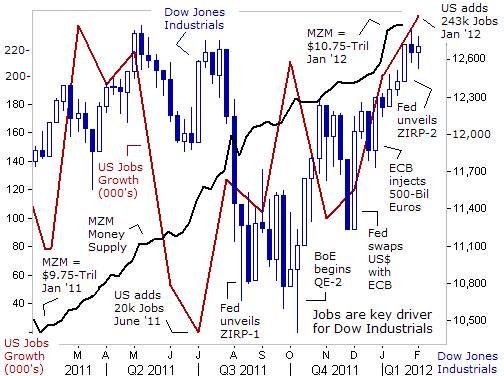
Incumbent presidents are always hard to beat. The powers of the presidency go a long way. Not since 1971 and early in the 1972 election year, when Nixon pressured Arthur Burns, then the Fed chairman, to expand the money supply with the aim of reducing unemployment, and boosting the economy in order to insure Nixon’s re-election, have traders seen such massive political pressure on the Fed to intervene in the markets in order to help a president to get re-elected. In order to constrain an outbreak of inflation, Nixon imposed wage and price controls, and won the election in a landslide.
Underneath the surface, the Fed was steadily increasing the high octane MZM Money supply, throughout the turbulent days of 2011. The size of the MZM Money supply has increased by $1-trillion from a year ago, to a record $10.75-trillion today. At the same time, Bernanke has gone far beyond the markets wildest imaginations, by pledging to keep borrowing costs for banks and hedge funds locked at zero-percent for the next three years. The Fed said that it aims to continue with its ultra-easy money policy until the US-jobless rate falls towards 6-percent from 8.3% today, and is willing to tolerate a higher inflation rate.
Only one US-president since World War II -- Ronald Reagan -- has been re-elected with a jobless rate above 6-percent. Reagan won a second term in 1984 with an unemployment rate of 7.2% on Election Day. Reagan won in a landslide since the jobless rate had fallen almost 3% in the previous 18-months, and a sizeable majority of US-voters thought the economy was moving in the right direction. By contrast, under Mr Obama the unemployment rate has dropped by 1.7% in the last 26 months – from a high of 10% in 2009. The Fed aims to keep the ultra-easy conditions in place that would enable the jobless rate to tumble to 7% by Election Day, even at the expense of faster inflation, to help Obama win a second term.
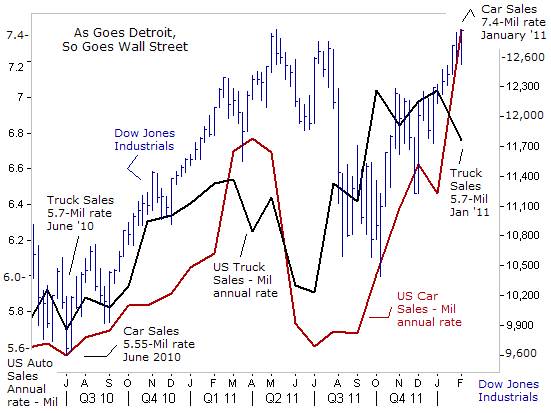
It’s starting to look as if the US-economy is on a steady, if unspectacular, upward trend. Considering how beaten down the economy has been, - it’s possible that Obama might find himself in the sweet spot of a virtuous cycle of a business recovery, in the months ahead. Republicans will claim that Obama’s policies deserve none of the credit. “Mr. President, we welcome any good news on the jobs front,” Romney said. “But it is thanks to the innovation of the America people and the private sector and not to you, Mr. President,” he added.
However, presidents tend to get the blame for everything bad that happens on their watch and receive credit for everything good. Obama’s chances for re-election are starting to look much better, after Labor department apparatchiks reported that US-employers added 243,000 workers to their payrolls in January, the biggest gain in nine months. The US-economy has created about a half-million jobs in the past two months, government bureaucrats says, and the unemployment rate dropped to 8.3% in January from 8.5% in December. Already, 2012 is looking like a winner for automakers -- just one month into the year.
Another hopeful sign for the US-economy’s future, - sales of new cars and trucks rose +11% to in January to 913,287, thanks to low borrowing costs and better loan availability. The sales pace accelerated to its highest level since the Cash for Clunkers program in August 2009. Chrysler had its best January in four years. If sales stay at January’s pace, they would reach 14.2-million, up from 12.8-million in 2011. While that’s below the 2000 peak of 17.3-million, it’s better than the 10.4-million trough hit in 2009. One reason car sales are improving is that buyers need to replace aging vehicles. The average age of a vehicle in the US is a record 10.8-years, nearly two years older than a decade ago. The bad news is that US-motorists are paying an average $31,300 for a new car, compared with $28,000 five years ago,
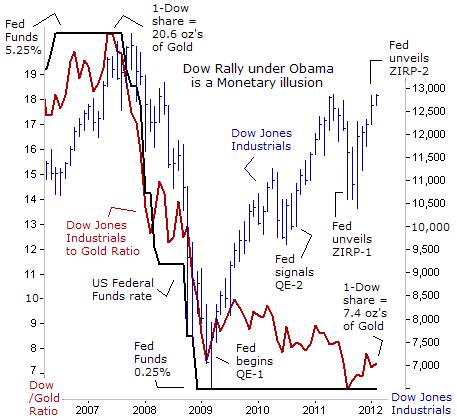
Historical observation reveals that the direction of the stock market has a notable influence over consumer confidence and spending levels. In particular, the top-20% of wealthiest Americans account for 40% of the spending in the US-economy, so the Fed hopes that by inflating the value of the stock market, wealthier Americans would decide to spend more. It’s the Fed’s version of “trickle down” economics, otherwise known as the “wealth effect.”
Yet when measured in “hard money” terms, or in comparison to the price of Gold, it becomes clear that much of the Dow’s “miracle rally” during the Obama administration was nothing more than a “monetary illusion,” inflated by the Fed’s hallucinogenic QE scheme. When seen thru the prism of Gold, 1-share of the Dow Industrials can only buy 7.4-ounces of Gold today. That’s slightly less than the exchange rate that prevailed at the bottom of the stock market’s slide in March 2009. Compared to the price of Gold, the Dow Jones Industrials is currently trading at its lowest level since 1992, - a 20-year low. In other words, without the Fed’s massive money printing operations, the stock market would be in a shambles today, and Obama’s chances at re-election would’ve been worse than Jimmy Carter’s in late 1980.
Just as the Dow’s historic rally is a mirage in hard money terms, the decline in the jobless rate to 8.3% is also deceptive. The fall in the headline unemployment rate has tumbled because the size of America’s workforce is shrinking – 4.8-million workers have simply given-up looking for a job over the past 31-months, and are no longer counted as unemployed. If these workers were counted as unemployed, the jobless rate would be at 11%. Nearly 24-million Americans remain unemployed, underemployed, or have just stopped looking for work. Long-term unemployment remains at record levels. If all these segments of the labor force are considered, the so-called U-6 jobless rate is at 15.1%, or equal to 1-in-6 American workers.
There’s also the issue of the purchasing power of US-wages. The average hourly earnings for private-sector US-employees for the past 12 months rose by a scant +1.9-percent. That’s well below the +3% rise in the consumer price index, resulting in a further lowering of workers’ real wages. There’s also been a widening disparity between corporate profits and worker’s wages. In Q’3 of 2011, US workers received just 44-cents in wages of every dollar of income earned in the US, the smallest share since 1947. In other words, whatever economic growth that’s been achieved over the past few years has also come at the expense of a sharply higher cost of living for many commodities and services. In contrast, US-corporations received more than 10-cents, up from 7.3-cents per dollar of income five years ago when the recession officially began, an increase of +37%, benefitting the top-10% of the wealthiest Americans that control 80% of the listed shares on Nasdaq and the NYSE.
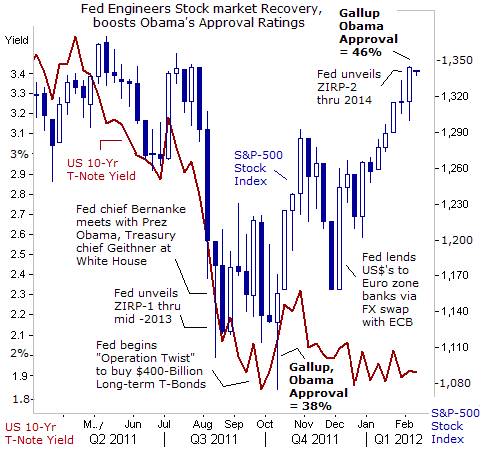
Still, the Fed figures that if it continues to pump-up the value of the stock market, eventually good tidings for the US’s asset based economy would follow. On Sept 21st, 2011, the Fed devised a brand new scheme to inflate the stock market’s value. The Fed said it would switch $400-billion of its portfolio into long-term Treasury bonds, in order to lock down long-term interest rates at historic low levels. The Fed telegraphed the move to Wall Street for weeks, dubbed “Operation Twist.” Since then, the Fed has locked the 10-year Treasury note yield below 2%, which is less than the 2.05% dividend yield that’s offered by the S&P-500 Index, and making the stock market look more attractive.
The Fed has been able to lock long-term bond yields at historic lows, even at a time, when the CBO reports that annual spending over the Obama era has climbed to a projected $3.6-trillion this fiscal year from $3-trillion in fiscal 2008, up more than 20%. The government’s share of spending in the US-economy has increased to 24%, up from an average of about 20% of GDP. This doesn’t include the $2-trillion tab for Obama Care. Under the Obama administration, the federal debt has mushroomed by about $5-trillion in a mere four years.
Since the Fed unveiled “Operation Twist,” the Dow Jones Industrials has soared +1,700-points higher, yet long-term Treasury yields remain “repressed” by the central bank. Typically, in a free and open marketplace, Treasury bond yields would’ve climbed sharply higher, alongside a booming stock market. Instead, the Fed has kept Treasury yields locked at artificially low levels. The massive degree of heavy handed intervention in the marketplace, and the manipulation of interest rates, the stock market, and currency exchange rates, is reminiscent of the Japanese capital and currency markets, and has also become the hallmark of the Bernanke Fed and the Obama administration.
However, according to the latest Gallup poll, the Fed’s intervention tactics are boosting Mr Obama’s ratings in the opinion polls. Gallup says 46% of American voters now approve of Mr. Obama’s performance in the White House. That’s up from 38% on October 4th, when the Fed rescued the stock market from the claws of the grizzly Bear. Historically, the best predictor of a president’s re-election chances is the approval rating. Since World War II, every president with an approval rating of at least 50% has won re-election. Every president with a rating clearly below 47% has lost. The most important driver of voter sentiment is the health of the labor market, and the number of net new jobs that are created.
But the Fed still has substantial work to do in order to insure Obama’s re-election: among the all-important independent voters likely to determine the outcome of the upcoming election, 47% approve of the way Obama is handling his job, and 50% disapprove. Many traders figure that if Obama is running neck and neck with Romney in the polls, the Fed could decide to take the politically risky gambit of unleashing QE-3, - printing anywhere from $600-billion to $1-trillion, and in turn, inflate the Dow Industrials to record highs above the 14,000-level.
If correct, there could be serious side-effects that could derail Obama’s re-election campaign. For instance, unleashing QE-3 could lift the price of North Sea Brent crude oil towards $150 per barrel, and jolt retail gasoline prices toward $5 /gallon. QE-3 could also lift the price of Gold above $2,000 /oz and trigger a broad based binge of speculation in the commodities markets, for grains, livestock, and base metals. That could usher in a whole new wave of consumer price inflation that would erode the purchasing power of US-wage earners.
Japan’s finance chief, Jun Azumi, said on Feb 2nd, that if the Fed unleashes QE-3, he would exert maximum pressure on the Bank of Japan (BoJ) to consider easing policy further, in order to prevent the US-dollar from falling below 75-yen, and to protect its export-reliant economy. “Yen buying has strengthened, led by short-term and speculative moves on the back of expectations for low interest rates in the US until 2014. I would like the BoJ to take account of economic conditions and various factors in deciding policy, including quantitative easing,” Azumi declared. Thus, if the Fed unleashes QE-3, the BoJ could provide traders with a double bonus, - QE-4 in Tokyo, and a whole new wave of yen carry trade speculation.
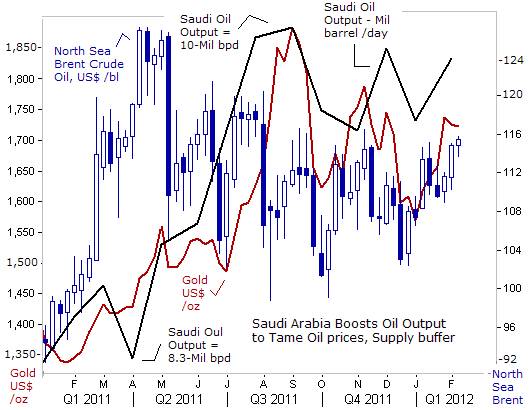
Saudi Arabia, the central banker of crude oil, is doing its part to counter the effects of QE in the Western world and Japan, by lifting its oil output to about 9.8-million barrels per day, up about 1.5-million bpd from a year ago. Riyadh is keeping the oil flowing at near record levels, even while Libya’s output of 1.5-million of high-grade light crude is gradually re-entering the marketplace. Still, the crude oil market is bubbly these days, with North Sea Brent trading above $115 /barrel, and gaining some upward momentum. Expectations of further rounds of QE in England, Japan, the US, and “Backdoor” QE in the Euro-zone are buoying the crude oil and Gold markets at historically high prices.
Suddenly, the financial media is swamped with speculation about a possible Israeli airstrike on Iran’s nuclear facilities in the months ahead, which if correct, could lift crude oil prices towards $200 per barrel, and wreck the fragile recovery in the US-economy. But it appears as though Israel’s public statements about a possible military strike against Iran's nuclear sites are a bluff designed to spur Europe and the US into adopting tougher economic sanctions on Iran in the months ahead. After all, if Israel was actually preparing to launch a military strike against Iran, it would not be broadcasting such an operation so openly. Israel’s attacks on nuclear sites in Iraq in 1981 and Syria in 2007 were launched in utmost secrecy.
Thus, traders in the Dow Jones Industrials reckon that the odds of an Israeli airstrike are very low. Instead, the US is expected to placate the Israelis by ratcheting up economic sanctions on Iran’s central bank, its oil industry, and oil shipping companies, in order to bring about a hasty collapse of the Iranian economy. The key question is whether Iran would deliver the first strike against Israel or US-bases in the Persian Gulf, if it thought its economy was crumbling and tough sanctions were threatening to topple the Ayatollah’s regime. In any event, the tension in the Middle East is a convenient excuse for oil traders to keep the price of North Sea Brent pegged near record highs, and in turn, helps to buoy the price of Gold.
Whatever the hurdles, traders have the utmost degree of confidence that the Bernanke Fed will always devise a new rescue scheme, and place a safety net under the stock market, if necessary, when risky bets go sour. Traders also believe the US-stock market is entering the sweet spot of the presidential election cycle, and it’s very hard to bet against it. There is a strong historical tendency for the market to trend higher over the course of the second half of the presidential cycle. Thus, with the Fed working round the clock for team Obama, and the size of the entitlement society reaching majority proportions, Mr Romney is seen as the long-shot candidate to win the presidency in November.
Romney’s Road to the White House seems like a episode of Mission Impossible, - his mission is to enable a majority of the American electorate to see through the Fed’s smoke screens, and the Labor department’s fuzzy math. If Romney beats the heavy odds that are poised against him, it would signal the end of Bernanke’s tenure at the Fed, and the end of his experiments with Bubble-mania and market manipulation.
This article is just the Tip of the Iceberg of what’s available in the Global Money Trends newsletter. Subscribe to the Global Money Trends newsletter, for insightful analysis and predictions of (1) top stock markets around the world, (2) Commodities such as crude oil, copper, gold, silver, and grains, (3) Foreign currencies (4) Libor interest rates and global bond markets (5) Central banker "Jawboning" and Intervention techniques that move markets.
By Gary Dorsch,
Editor, Global Money Trends newsletter
http://www.sirchartsalot.com
GMT filters important news and information into (1) bullet-point, easy to understand analysis, (2) featuring "Inter-Market Technical Analysis" that visually displays the dynamic inter-relationships between foreign currencies, commodities, interest rates and the stock markets from a dozen key countries around the world. Also included are (3) charts of key economic statistics of foreign countries that move markets.
Subscribers can also listen to bi-weekly Audio Broadcasts, with the latest news on global markets, and view our updated model portfolio 2008. To order a subscription to Global Money Trends, click on the hyperlink below, http://www.sirchartsalot.com/newsletters.php or call toll free to order, Sunday thru Thursday, 8 am to 9 pm EST, and on Friday 8 am to 5 pm, at 866-553-1007. Outside the call 561-367-1007.
Mr Dorsch worked on the trading floor of the Chicago Mercantile Exchange for nine years as the chief Financial Futures Analyst for three clearing firms, Oppenheimer Rouse Futures Inc, GH Miller and Company, and a commodity fund at the LNS Financial Group.
As a transactional broker for Charles Schwab's Global Investment Services department, Mr Dorsch handled thousands of customer trades in 45 stock exchanges around the world, including Australia, Canada, Japan, Hong Kong, the Euro zone, London, Toronto, South Africa, Mexico, and New Zealand, and Canadian oil trusts, ADR's and Exchange Traded Funds.
He wrote a weekly newsletter from 2000 thru September 2005 called, "Foreign Currency Trends" for Charles Schwab's Global Investment department, featuring inter-market technical analysis, to understand the dynamic inter-relationships between the foreign exchange, global bond and stock markets, and key industrial commodities.
Copyright © 2005-2012 SirChartsAlot, Inc. All rights reserved.
Disclaimer: SirChartsAlot.com's analysis and insights are based upon data gathered by it from various sources believed to be reliable, complete and accurate. However, no guarantee is made by SirChartsAlot.com as to the reliability, completeness and accuracy of the data so analyzed. SirChartsAlot.com is in the business of gathering information, analyzing it and disseminating the analysis for informational and educational purposes only. SirChartsAlot.com attempts to analyze trends, not make recommendations. All statements and expressions are the opinion of SirChartsAlot.com and are not meant to be investment advice or solicitation or recommendation to establish market positions. Our opinions are subject to change without notice. SirChartsAlot.com strongly advises readers to conduct thorough research relevant to decisions and verify facts from various independent sources.
Gary Dorsch Archive |
© 2005-2022 http://www.MarketOracle.co.uk - The Market Oracle is a FREE Daily Financial Markets Analysis & Forecasting online publication.


