U.S. January Employment Situation Shows Widespread Improvement, but Short of Full Employment Mandate
Economics / Employment Feb 04, 2012 - 09:14 AM GMTBy: Capital3X
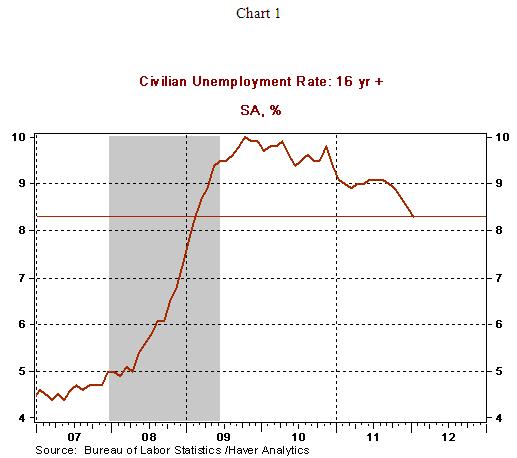
 Civilian Unemployment Rate: 8.3% in January, down from 8.5% in December. Cycle high jobless rate for the recent recession is 10.0% registered in October 2009.
Payroll Employment: +243,000 jobs in January vs. +203,000 in December. Private sector jobs increased 257,000 after a gain of 220,000 in December. A net gain of 60,000 jobs followed after revisions to payroll estimates of November and December
Private Sector Hourly Earnings: $23.24 in January vs. $23.20 in December; 1.9% y-o-y increase in January vs. 2.1% gain in December.
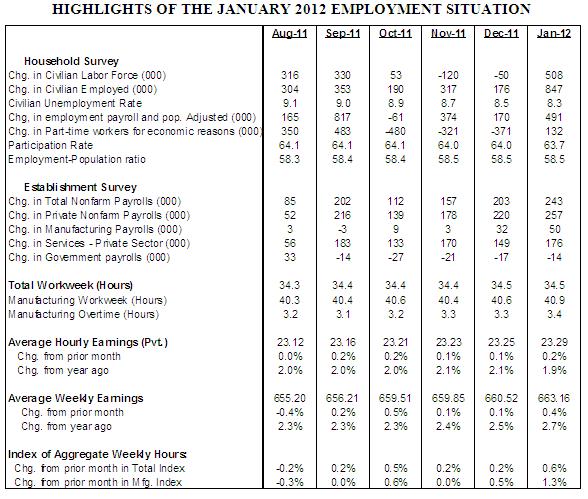
Household Survey - The unemployment rate fell to 8.3% in January from 8.5% in the prior month. The current level of the jobless rate is the lowest in three years. The unemployment rate recorded meaningful declines across all major categories of the labor force - white adult men (7.7% vs. 8.0% in December), white adult women (7.7% vs. 7.9% in December), African Americans (13.6% vs. 15.8% in December), less than high school diploma (13.1% vs. 13.8% in December), some college or associated degree (7.2% vs. 7.7% in December).
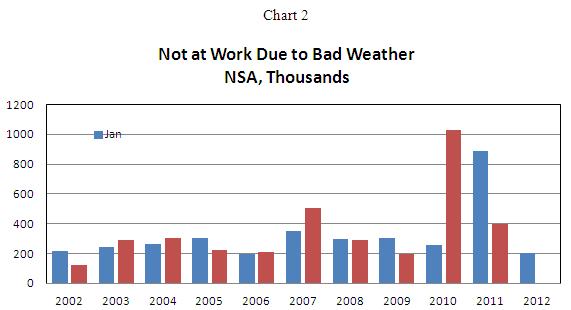
The expansion of the labor force (+508,000) in January after two months of declines was expected, while the increase in employment (+847,000) was an upside surprise. The number of people who were unable to get work in January because of inclement weather was smaller (206,000) than typical (see Chart 2). Therefore, warm weather lent a small helping hand to raise employment, but the total gain still stands out.
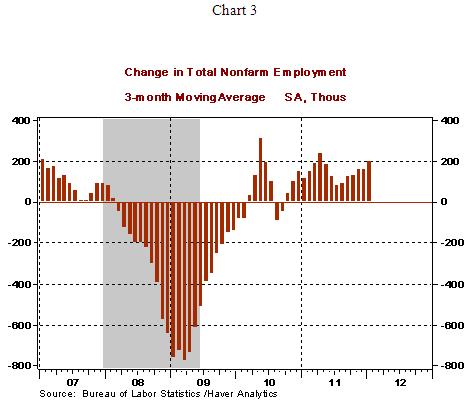
Establishment Survey - Total payroll employment increased 243,000 in January, putting the total number of jobs created since the trough of the Great Recession at 1.906 million. On average, 201,000 jobs have been created in the past three months.
Highlights of changes in payrolls during January 2012:
Construction: +21,000 vs. +31,000 in December
Manufacturing: +50,000 vs. +32,000 in December
Private sector service employment: +257,000 vs. +220,000 in December
Retail employment: +11,000 vs. +6,000 in December
Professional and business services: +70,000 vs. +63,000 in December
Temporary help: +20,100 vs. +8,300 in December
Financial activities: -5,000 vs. +4,000 in December
Health care: +30,900 vs. +17,600 in December
Government: -14,000 vs. -17,000 in December
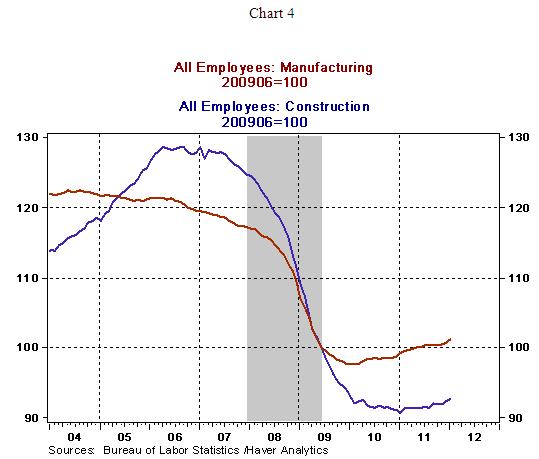
An index chart sets the level of employment at the trough equal to 100 in order to assess the extent of improvement in employment after an economic recovery/expansion. Charts 4 and 5 are index charts, where a reading of 102 implies that hiring has risen 2.0% from the trough, while 95% would mean it has fallen by 5.0%. The gain in manufacturing jobs has raised the number of jobs in this sector past the low seen at the trough but the increase in employment in the construction sector is small and still significantly below the level seen at the trough of the Great Recession. At the same time, the good news that the number of jobs in the construction sector appears to have bottomed out (see Chart 4).
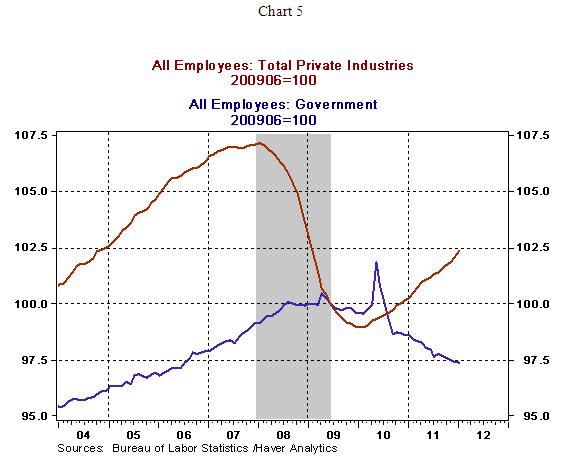
Applying the same methodology to the entire private and public sectors, private employment has risen 2.3% from the trough and government employment continues to decline (see Chart 5). Government employment is 2.65% below the level seen in June 2009.
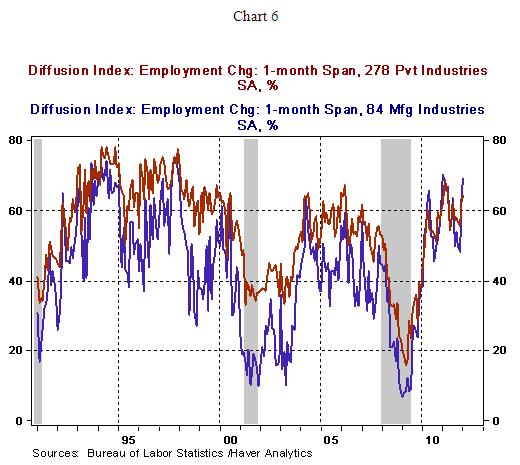
The number of industries hiring in the overall private sector (64.1%) and the factory sector (69.1%) was widespread in January such that it compares with levels seen in the expansion phase of the prior business cycle.
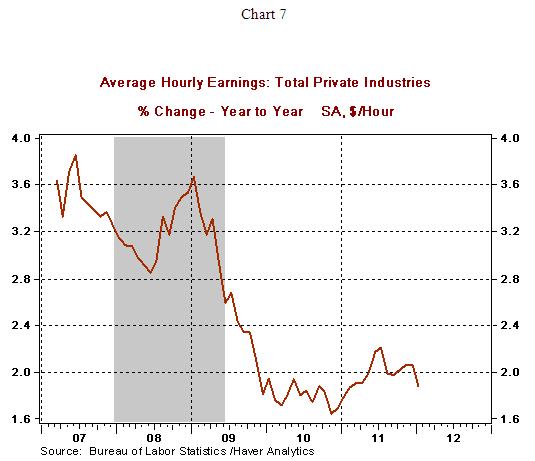
The 1.6% jump in the manufacturing man-hours index augurs positively for a strong jump in industrial production during January. The 0.2% gain in hourly earnings combined with the increase in payrolls should yield a noticeable increase in personal income during January, which has been languishing for several months. The year-to-year change in hourly earnings (+1.9%) continues to place the Fed in a favorable position if and when it considers a third round of quantitative easing.
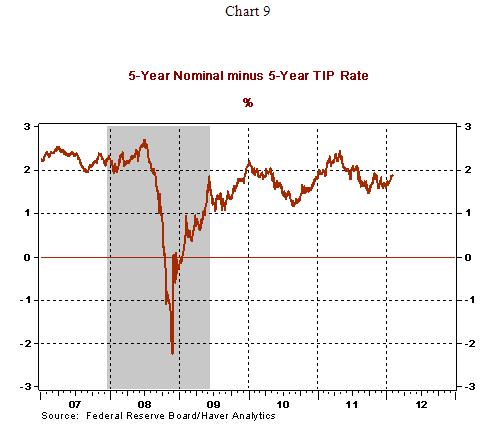
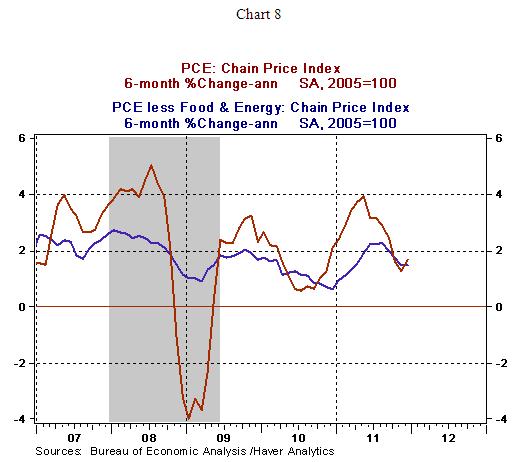
Conclusion - The positive tone of the January employment report is noteworthy. But, the 8.3% jobless rate of January is a far cry from the Fed’s latest estimate of a long term unemployment rate of 5.2-6.0%. As Charts 4 and 5 indicate, hiring remains far from the peak seen in the earlier business cycle and there is still a large amount of unused labor capacity in place. Current inflation and inflation expectations do not present a threat. The personal consumption price index (the Fed's preferred measure of inflation) shows a moderating trend after recording high readings in spring and summer of 2011 (see Chart 8). Inflation expectations are also running below levels seen in the early months of 2011 (see Chart 9). Putting together the current inflation and unemployment readings, the third round of quantitative easing remains in the realm of possible action in the near term to enable the Fed to fulfill its dual mandate of full employment and price stability
Asha Bangalore — Senior Vice President and Economist
http://www.northerntrust.com
Asha Bangalore is Vice President and Economist at The Northern Trust Company, Chicago. Prior to joining the bank in 1994, she was Consultant to savings and loan institutions and commercial banks at Financial & Economic Strategies Corporation, Chicago.
Copyright © 2012 Asha Bangalore
The opinions expressed herein are those of the author and do not necessarily represent the views of The Northern Trust Company. The Northern Trust Company does not warrant the accuracy or completeness of information contained herein, such information is subject to change and is not intended to influence your investment decisions.
© 2005-2022 http://www.MarketOracle.co.uk - The Market Oracle is a FREE Daily Financial Markets Analysis & Forecasting online publication.


