Is a Stock Market Crash Imminent? No
Stock-Markets / Stock Markets 2012 Jan 31, 2012 - 03:48 AM GMTBy: Bob_Clark

 Traders use pattern recognition for making trading decisions. We have an interesting situation developing in the American stock markets that is worth knowing about. Cyclically it is deja vu all over again.
Trading on fundamentals.
The media has been painting a dire picture of the world economies, leading many to dump their holdings right in the bottom last October. Nothing unusual there, anyone trading on fundamental predictions and data will eventually go broke.
The shame of it is that many new investors that have become frustrated with the under performance of their advisors and subsequently taken over managing their own money, will fall victim to the Fat Boys and their media machine. Most new investors think that logical analysis of news and data is the way to predict the future movement of stock prices. Wrong.
The markets do work on logic but it has nothing to do with the constant stream of crap we are fed by the fat Boys each day.
Think about it, who owns the media and who does it really serve. The news we are fed is designed to panic us out at the bottom and suck us in at the top.
Cycles?
If you choose to manage your own account, maybe you should look at using some form of technical analysis.
Cycles are a simple way to stay on the right side of the market. They don't require much time when we are monitoring our investments and they can give us the vital signs of any market.
They are not a panacea, the Fat Boys know about them and use them to their advantage. That is why they are still around and why they are still useful in predicting the future movement of stocks, or gold. Anything really.
As with many forms of technical analysis, cycles can be most useful when they don't do what they are expected to do.
We are at one of those points right now.
The thing we have to understand first, is that cycle tops are not regular and unvarying. They can top early, or late relative to their normal duration. This is known as translation. Lows tend to be more constant.
Below is an example of early, neutral and late translation.

What translation tells us
How a cycle tops out tells us a lot about what is coming next. The reason for this is what I call relativity, which says that each small cycle revolves around the larger cycle and is dominated by it.
It is beyond the scope of this article to explain why but what late translation of a small trading cycle means, is that the sum of all cycles larger than the smaller trading cycle that topped late are going up. I mention this because that is what is happening in the S&P 500 right now.
To be able to study a chart and know what the cycle is telling us, we first have to find what cycles are active and effective in a trading instrument. Again to simplify this article, I have identified two key cyclical components in the stock market. The first is the 1 year cycle and the second is the 4 month trading cycle. I watch the 4 month cycle to see where is translates and that tells me what the 1 year cycle is most likely doing. (Notice that the cycle's lows in the chart below are not totally reliable. The 4 month can extend to 5 months and the 1 year low came in late last year as well. That is what causes traders to give up on cycles. They are just one tool, not a panacea.)
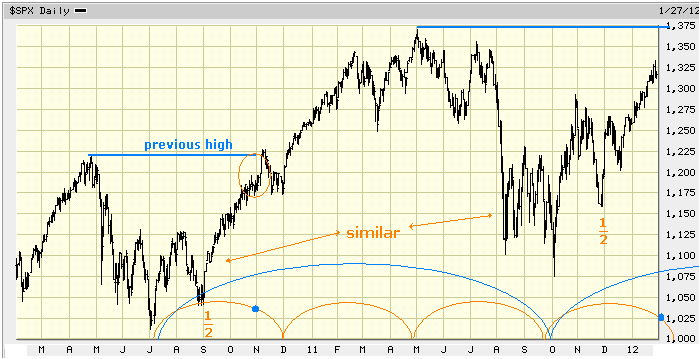
Let's look at the two year chart of the S&P 500 index below.
Notice how similar the pictures we made in the two, 1 year lows are. I am counting the low we see in early October as a 1 year low, the same as we got in July of 2010.
Also notice what we have done since making the October low. Pretty much the same thing as late 2010. I have put in a circle to mark a "you are here point."
A quick look and we immediately know that we are due for a 4 month trading cycle low. We also know that because the low is going to be higher than the low we saw in October, plus the fact that its top is coming so late (late translation), says the larger cycles (1 year and bigger) are still in the ascendancy. I have drawn arcs to represent the cycles at the bottom of the chart.
That is why traders are starting to attack the long side so aggressively now, as they did in late 2010. They are anticipating a breakout to new highs and a continuation rally like we saw then.
That is a small example of how simple technical analysis can take the blinders off.

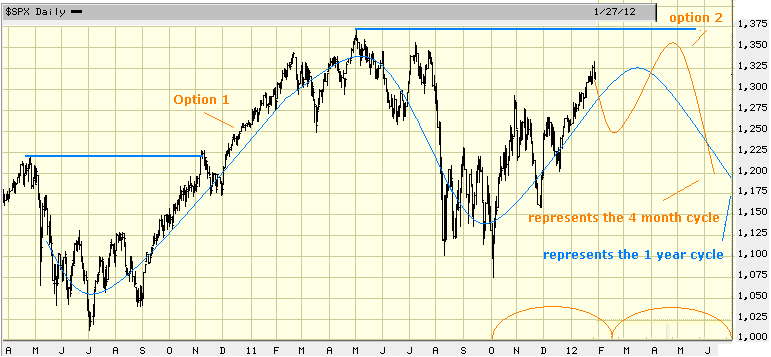
Below we see there is another possible outcome.
What happened after the last 1 year low in July 2010 is etched in trader's memories. They recognize the pattern and are assuming it will do the same thing again. We can call it option 1. They are rushing in now so they don't miss the move. Clearly the 1 year cycle is going up and until proven wrong that is the way to bet.
What can go wrong is that the 1 year cycle can roll over early. Let's call that option 2. That can set up several model scenarios. The one I have drawn in is a simple one. There are variations but they all mean the rally doesn't have to go much higher. Possibly forming a double top.

How to trade it
I am not saying the rally will fail, or that option 2 will happen. As traders and investors what we must do is understand the possibilities and what they will look like if they happen. Then we go with the best probability. Normally a 1 year cycle can rally for more than 4 months. We trade in the direction of the trend, with a stop loss to protect us from the variables. We never trade without a stop loss.
We see that even if the 1 year cycle is going to roll over in the next few months, the smaller 4 month trading cycle will be revolving around it and after a low that is due shortly, we will be going higher. Maybe not with the same ebullience as last time however. Long is the way to bet for now.
Be prepared
Variables happen and this is a good time for one. Many traders can remember back to last year and they are going to bet on that same pattern repeating. When they do, it gives the Fat Boys the victims they need on the other side of their trade.
I will be betting the same way and buying, knowing I may be a potential victim, but with the knowledge that the same thing usually does not happen twice. We have two road maps, or options. We know what a healthy move should look like and we will put the second option, the failure model, on the radar as well. Then we will watch for cracks.
If you are managing your own money, either as a professional trader or an investor. I will teach you to be consistently profitable. This month I am offering my full course at half price. It will take you to a professional level with guaranteed success. Everyday there is a specific trade that you will learn to see and profit from. There is no limit on your income.
Bob Clark is a professional trader with over twenty years experience, he also provides real time online trading instruction, publishes a daily email trading advisory and maintains a web blog at www.winningtradingtactics.blogspot.com his email is linesbot@gmail.com.
© 2012 Copyright Bob Clark - All Rights Reserved
Disclaimer: The above is a matter of opinion provided for general information purposes only and is not intended as investment advice. Information and analysis above are derived from sources and utilising methods believed to be reliable, but we cannot accept responsibility for any losses you may incur as a result of this analysis. Individuals should consult with their personal financial advisors
© 2005-2022 http://www.MarketOracle.co.uk - The Market Oracle is a FREE Daily Financial Markets Analysis & Forecasting online publication.


