


Will the Stock Market Stay Safe or Get Into Trouble This Week?
Stock-Markets / Stock Markets 2012 Jan 30, 2012 - 07:55 AM GMTBy: Marty_Chenard

One of the daily research data sets we calculate every night is from a computer run on every stock on the S&P 500 index.
During that analysis, we measure the Strength levels of each stock and do a count of how many had positive strength that day, and how many had negative strength.
Sounds simple, but the story it tells is very important to investors. Here is why ...
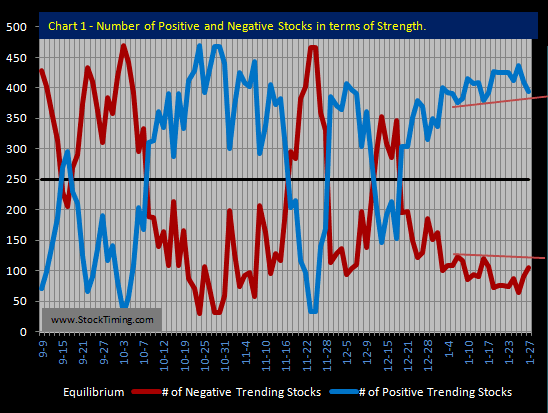
Think about it for a moment ... since there are 500 stocks on the S&P 500, then 250 stocks is the half way point. Therefore, if over 250 stocks are positive, then the strength of the overall index is positive. And if that continues to trend higher, then the market has to also trend higher. Upside trending movement can be seen by looking at the blue trend line on today's chart. (The opposite condition can be seen by looking at the red trend line that depicts how many S&P stocks have negative strength on the chart.)
So, looking at today's chart, the trend of positive stocks is good. What you see is an up trend because it has been making higher/lows and higher/highs.
That brings us to the challenge we have in front of us this week . If you look at the chart, you can see a rose colored support line under the positive stock line. That is the challenge test for this week . For the trend to continue up, the number of positive stocks must hold above that support and higher than the previous low set on January 13th. of this year. Otherwise, we will see a rocky market with profit taking and down movement.
FYI ... there are a number of other daily studies on the S&P that we post daily relative to this study on the Standard subscriber site. One of the other studies show's the number of Very Strong stocks each day. The importance of this number is that these are rally "feeder stocks". We call them that, because if their numbers are rising, then they pull the broad market higher. If their numbers are dropping, then they will pull the market lower.
By Marty Chenard
http://www.stocktiming.com/
Please Note: We do not issue Buy or Sell timing recommendations on these Free daily update pages . I hope you understand, that in fairness, our Buy/Sell recommendations and advanced market Models are only available to our paid subscribers on a password required basis. Membership information
Marty Chenard is the Author and Teacher of two Seminar Courses on "Advanced Technical Analysis Investing", Mr. Chenard has been investing for over 30 years. In 2001 when the NASDAQ dropped 24.5%, his personal investment performance for the year was a gain of 57.428%. He is an Advanced Stock Market Technical Analyst that has developed his own proprietary analytical tools. As a result, he was out of the market two weeks before the 1987 Crash in the most recent Bear Market he faxed his Members in March 2000 telling them all to SELL. He is an advanced technical analyst and not an investment advisor, nor a securities broker.
Marty Chenard Archive |
© 2005-2022 http://www.MarketOracle.co.uk - The Market Oracle is a FREE Daily Financial Markets Analysis & Forecasting online publication.