


Stock Market Bad News Just Around the Corner?
Stock-Markets / Stock Markets 2012 Jan 25, 2012 - 03:06 AM GMTBy: Marty_Chenard

Is there bad news just around the corner ???
Technical analyst agree that a falling wedge pattern is a bullish pattern. As a pattern, its bullishness just stays dormant until the breakout occurs.
It is a great pattern for technicians because its failure rate is only 10% which means it has an accuracy level of 90%.
So why are we discussing this pattern today?
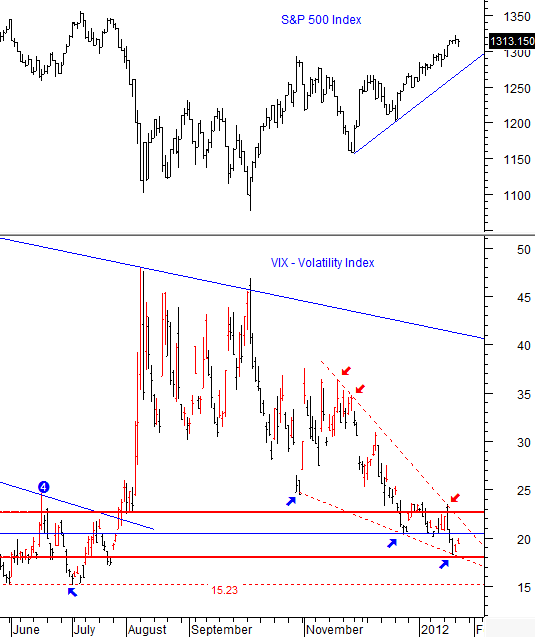
Because there is now such a pattern ... a nice, two and half month long pattern.
That's the good news, now for the not so good news ...
The pattern is showing up on the VIX (Volatility Index). As you know, the VIX is often regarded as the Fear Index and the VIX moves in the opposite direction of the stock market.
Therefore, this normally positive news pattern has some very negative implications attached to it. Technically, for this particular pattern, the maximum run time before the breakout is during the third week of February. However, that is when the apex of the resistance and support lines is formed.
The reality is that these patterns always breakout before the apex. Seldom is that breakout longer than seven-eights (distance) into the pattern which would be about February 8th.
The beginning timeline for a probability increase of a breakout starts after being two-thirds into the pattern ... and that date was January 23rd. So now, we are in the breakout window area where the probability for a breakout will increase as time moves toward February 8th.
Bottom line ... market risk levels will now start to increase as we move forward. (FYI: This chart is one of three VIX charts that are updated daily in Section 4 of our Standard subscriber site.)
By Marty Chenard
http://www.stocktiming.com/
Please Note: We do not issue Buy or Sell timing recommendations on these Free daily update pages . I hope you understand, that in fairness, our Buy/Sell recommendations and advanced market Models are only available to our paid subscribers on a password required basis. Membership information
Marty Chenard is the Author and Teacher of two Seminar Courses on "Advanced Technical Analysis Investing", Mr. Chenard has been investing for over 30 years. In 2001 when the NASDAQ dropped 24.5%, his personal investment performance for the year was a gain of 57.428%. He is an Advanced Stock Market Technical Analyst that has developed his own proprietary analytical tools. As a result, he was out of the market two weeks before the 1987 Crash in the most recent Bear Market he faxed his Members in March 2000 telling them all to SELL. He is an advanced technical analyst and not an investment advisor, nor a securities broker.
Marty Chenard Archive |
© 2005-2022 http://www.MarketOracle.co.uk - The Market Oracle is a FREE Daily Financial Markets Analysis & Forecasting online publication.