


Stock Market Trend and Geomagnetism
Stock-Markets / Stock Markets 2012 Jan 23, 2012 - 02:53 AM GMTBy: John_Hampson

 A correlation between stock market performance and geomagnetism is captured in a paper here by Krivelyova and Robotti. That aside, it is a rarely used discipline in trading, and if you search Marketwatch, Bloomberg and CNBC for its reference, you will come away empty handed. My latest findings are about to demonstrate its importance.
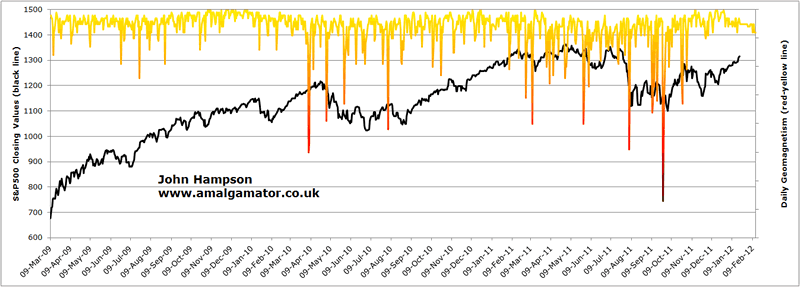
Here is daily geomagnetism versus the S&P500 stock index since the cyclical bull market begain in March 2009. The red-yellow spikes down are high geomagnetic disturbances, and the two periods in which they are strongest correspond to correction periods in the stock market. In between and either side, stocks advance during periods of relatively benign geomagnetism.
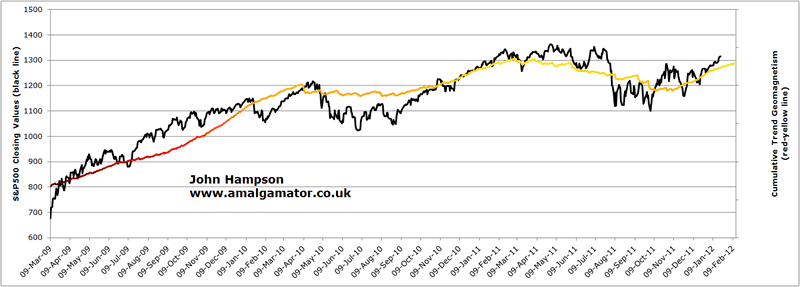
If you are not yet convinced of a correlation between the two, then let's make the daily geomagnetism into a cumulative trend line. Out pops a route map for the market:
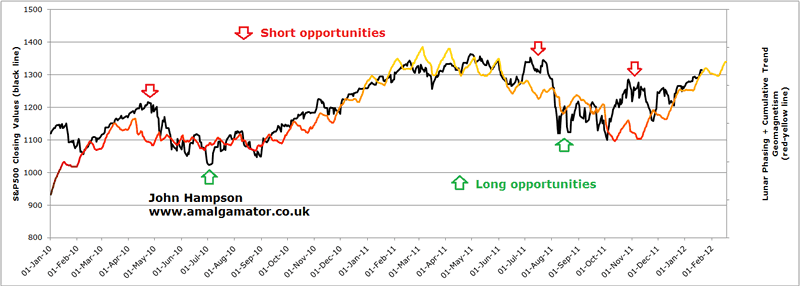
Now let's combine cumulative trend geomagnetism with lunar phasing (a correlation between stock market returns and lunar phases is established in this paper by Dichev and Janes) and zone in on the last two years to see a bit more detail. The result is a model that not only captures the stock market's route map but often the shorter term waves also. In addition, where the stock market strays from the model these provide good short and long opportunities, as highlighted.
Lastly, note the tail on the red-yellow line that stretches several weeks into the future. We know lunar phases in advance and can predict geomagnetism up to three weeks out (but like weather forecasts, not 100% accurately). That gives us a predictive tool as we can assess the likely waveform, the trend direction, and any notable straying of the stock market from the model. Returning to the first chart above, we can also look out for high geomagnetic disturbances occuring, as there is often a lagged effect on the stock market. You can follow both these models at my site, www.amalgamator.co.uk
John Hampson, UK / Self-taught full-time trading at the global macro level / Future Studies www.amalgamator.co.uk / Forecasting By Amalgamation.
© 2012 Copyright John Hampson - All Rights Reserved Disclaimer: The above is a matter of opinion provided for general information purposes only and is not intended as investment advice. Information and analysis above are derived from sources and utilising methods believed to be reliable, but we cannot accept responsibility for any losses you may incur as a result of this analysis. Individuals should consult with their personal financial advisors.
© 2005-2022 http://www.MarketOracle.co.uk - The Market Oracle is a FREE Daily Financial Markets Analysis & Forecasting online publication.