How Bond yields and Money Supply influence Stock Prices
Stock-Markets / Stock Markets 2012 Jan 12, 2012 - 09:05 AM GMTBy: Sam_Chee_Kong
 What is a Bond? A bond is a form of debt like a loan or IOUs. A Corporation like AIG may raise fund through the sale of bonds, a city may sell bonds to build a bridge or the Federal Government may issue bonds to finance spiraling debts. All of these entities need money to operate and they do so by issuing bonds.
What does it mean when you have a bond with a face value of $1000, a 5% coupon rate and with a 10 year maturity? It means that your bond will pay you $50 per year in interest for the next ten years. At the end of the 10 year maturity you will also get back your original $1000.
Two types of bonds
Basically there are two types of Bonds i.e. the coupon and discount bond. A coupon bond pays the owner of the bond a fixed interest payment until maturity which has already been discussed above. The coupon payment is so called because in the olden days the bond holder used to obtain payment by clipping a coupon off the bond and send it to the issuer who in turn will send the payment to the holder. Of course nowadays it is no longer needed to send in coupons to receive payments.
The second type of bond is the discount bond or zero-coupon bond. Normally, it is sold at a price below its face value and this type of bond don’t pay any interest. Say if you buy a discount bond at $900 with a face value of $1000 with a maturity of 1 year. Then in a year’s time you will be repaid with the face value of $1000. U.S Treasury Bills and U.S savings bonds are some of the examples of discount bonds.
Risk associated with Bonds
Does Bond carry any risk? Yes there are various risk associated with holding bonds such as counter-party risk. Counter-party or Credit risk is the external risk that any investments face. The credit risk to a bond is that the counter-party — in this case the debtor — will default on their obligations or unable to pay the interest and repay the principal as agreed.
It must be taken into consideration that the market price of the bond in the secondary market varies inversely with the perceived credit risk associated with the security and in this case bond. If the credit risk of a bond that is purchased increases then the bond can only be resold at a reduced priced.
Secondly it is the Interest rate or Market risk. Interest rate risk refers to the volatility of bond prices due to the changes in interest rates. This is because price volatility of bond prices increases as the maturity increases. As a result financial institutions tend to hold a relatively short term maturity bond portfolio. For those who can stomach a higher risk bond portfolio then they can hold a longer maturity portfolio which consists of municipal bonds. Municipal bonds normally carry a longer maturity and they are more risky than U.S Government Treasury bonds. This can be seen by the default of many municipal bonds in the past year.
Lastly, it is the Liquidity risk. Liquidity risk refers to how quick or easy the holders of the bonds will be able to sell or liquidate to convert to cash, without causing much fluctuation in its price. There are two aspects to this problem. One, it will be whether there exist any secondary market for this particular security. If the secondary market does not exist then the liquidity risk is certainly high. Two, if the secondary market do exist then the next issue is whether the market is highly developed. The secondary market for Treasury bills is much highly developed than municipal bonds. Generally speaking the secondary market for municipal bonds is much ‘thinner’ than U.S Government securities and hence it is not so easy raise cash through municipal bonds when the need arise. This is because the difference between the bid/ask will be very wide and on top of that not many buyers will be found.
Of course, if you hold onto your bond until maturity, it doesn’t matter how much the price fluctuates. Your interest rate was set when you bought it, and when the term is up, you’ll receive the face value (the money you initially invested) of the bond back — so long as the issuer doesn’t blow up. But if you need to sell your bond on the secondary market – before it matures – you could get less than your original investment back.
The equity market cannot remain separated from the bond market for too long. If the bond market is pointing to a protracted slow down, no matter how good the expected earnings might appear to be, the equity market does eventually end up recalibrating downwards. Why? Long term low bond yields imply collective investor belief that global growth will slow down markedly for many years to come if not decades. As a result, earnings expectations also have to be recalibrated downwards. Commodity prices and property prices also end up falling to reflect the decline in global and domestic demand over time.
Negative interest rates ?
Can Bonds have negative yields? We all assumed that interest rates must always be in the positive territory. However there are times where bonds are paying negative interest rates. Negative interest rates means that you are willing to sacrifice for a lower return on your money in the future say 5 years from now, than what you are getting now.
Events during the 1990s in Japan and the sub-prime crisis in the U.S during November 2008, demonstrates that negative interest rates could happen due to extreme fear in the economic conditions such as financial meltdown. Such fear will drive people towards the bond market to seek safe haven and thus large investors don’t mind parking their funds in the bond market instead of holding cash or deposits in banks. This is why they don’t mind if bond yields goes below zero.
In the Japanese case during the 1990s and early 2000s, its economy was experiencing a deflation or negative inflation rate. During 1998, the interest rate on Japanese 6 month Treasury Bills actually dropped below zero. During negative inflation, the demand for bonds will rise because the expected return on real assets such as land, buildings and etc will fall. The increase in the demand for bond will push up the price of bond while at the same time result in a fall in interest rate. This is because debt price varies inversely with debt yields.
Different yield curves and its effect on Equities
Interest rates, however, have a big impact on bond prices. As interest rates rise, bond prices fall. That’s because when rates climb, new bonds are issued at the higher rate, making existing bonds with lower rates less valuable. A plot of the yields (interest rate) on bonds with different maturity will produce what we termed as the yield curve.
Normally there are three different types of shapes a yield curve can produce such as upward sloping, downward sloping and flat or humped curve. The shape of the yield curve is important because it tells us the rate of change in the interest rate and economic activities in the future say 5-10 years later.
Upward Sloping
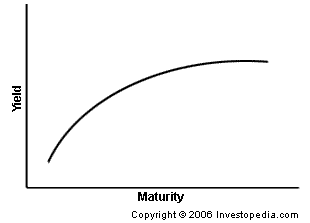
When the yield curve slope upward the short term rates will rise gradually towards maturity as can be demonstrated with the following curve. When investors expect the economy to be strong in the coming years, they are willing to take higher risks for holding the bonds with a longer maturity. They will be rewarded with progressively higher interest rates and the curve move upwards. This type of curve also indicates that that the economy and the stock market are in an upward expansion.
Under such conditions, the stock market will also be expected to do well over the next few years due to the feel good effect and also the increase in the confidence level due to the expectation of better times ahead.
Downward Sloping
Secondly we have the inverted yield curve meaning short term yields are higher than long term yields. Inverted yield curve represents what investors viewed the economy and the stock market is getting worse off in the future. Inverted curve is rare but do not ignore them. They always followed by economic slowdown and recession and hence falling interest rates and would not bode well for the stock market in the near term..
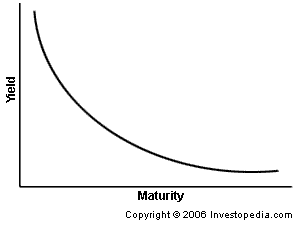
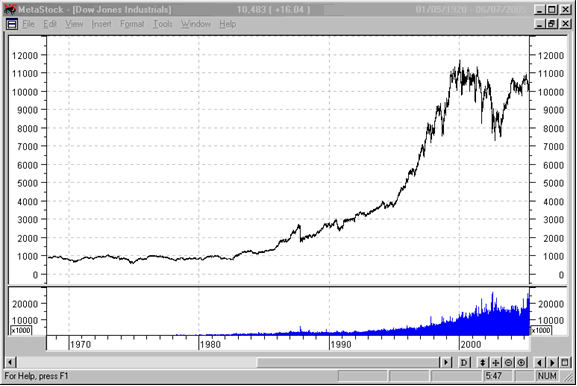
This happened during the ‘Volcker’ effect in 1981, where then Fed Chairman Paul Volcker announce the increase of the interest rate to 18%. With such punishing rate of interest, bond traders viewed that recession will be next to happen and hence lock in the more than 10% yields in the next few years. True to form, when the economy collapsed in the next few years interest rates fell to a low of 7%. A fall in the interest rates during the next few years initiated one of the biggest bull run in the history of the United States from 1983-2000 which can be showed by the chart below.
Flat or Humped Curve
Thirdly we have the flat or humped curve. This is a situation where both the short term yields and long term yields are almost similar. Under such conditions, the odds for a recession and economic slowdown are pretty good. Hence it will affect the stock market movement in future, in this case more likely on the downside.
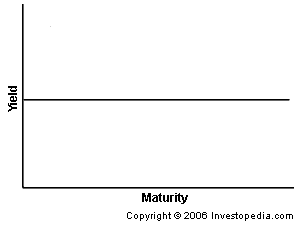
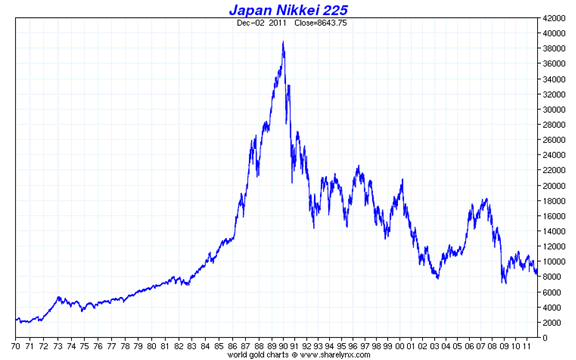
One example will be Japan during the early 1990s until now. The Japanese interest rates are held close to zero most of that time and its stock market fell from its peak of 38,957 on Dec 1989, to a low of 7054 on March 10, 2009. This represents a 81.9% drop from the peak and during this period it is also known as the ‘two lost decades’ of Japan. It is best described with the following chart.
How Money Supply or Aggregates affect Equities prices?
What is money? To a layman, money just consists of currency (paper money) and coins. To an economist a broader definition of money is needed which will includes checks, savings deposits and other forms savings or investments which can easily be converted to cash or also known as ‘very liquid’.
Money performs three main functions in an economy, which is a medium of exchange, a unit of account and also as a store of value.
Money in the form of currency serves as a medium of exchange for the payment of goods and services that is provided by another party. In this way it will help promote efficiency by reducing the time spent on the exchange of goods and services. To illustrate the importance of money in our daily life, imagine we are in a barter economy. David is a barber and if he wants to buy some meat, he needs to find a butcher who at the same time also needs a haircut. He needs to approach many butchers until he finds one that needs a haircut.
So in a way the time spent trying to find the right person to exchange its goods and services will be time consuming and eventually leads to what we called the ‘transaction cost’.
Secondly, money also plays the role as to provide a unit of account or measure. We measure the value of goods and services in terms of money as we measure weight in kilograms. If we don’t have a unit of measure, as in the above example how many haircuts the barber has to give the butcher to exchange for a leg of lamb?
Thirdly, money as a store of value is important as we do not spend all the money we received immediately but to store it for a later date to spend it. Money still offers the best ‘store of value’ over other assets such as antiques, arts, land, houses and etc, because money is the ‘most liquid’ among them. You don’t need to wait for the house or land to be sold in order to receive cash and this is why it is a more preferred medium as a ‘store of value’ even though other assets offer better returns over time
Since over time different assets like gold, currency, coins and etc have perform the role as money, how do we define money supply or aggregates in an economy? Different countries have different definitions of money supply because their central banks define money supply differently. Two of the more common definitions of money supply is the following,
U.S. Eurozone
M1 Currency Currency
+ travelers checks + Overnight deposits
+ demand deposits
+ other checkable deposits
M2 M1 M1
+ Time deposits + Deposits (2 years maturity)
+ Savings deposits + Deposits Redeemable in 3 months
+ MMF Shares
M3 N/A M2
+ Repurchase agreements
+ MMF shares
+ Debt Securities up to 2 years
So by adding up the money aggregates of M1 + M2 + M3, it will represent a country’s Money Supply.
Money Supply and Equity prices
According to the findings of the ERSTE group, they believe that changing dynamics of money supply is a good indicator of movements in the equity markets. Historical data shows that increasing money supply helped to elevate equity prices while decreasing money supply will dampen equity prices.
It also found that in order to continue driving equity prices higher the market needs a consistently higher amount of money supply. In other words, the market is addicted to ‘consistently new supply of money’ without which it will lose its momentum.
They also found that money aggregates which consists of M1 and M2 are good short term indicators of future equity price movements.
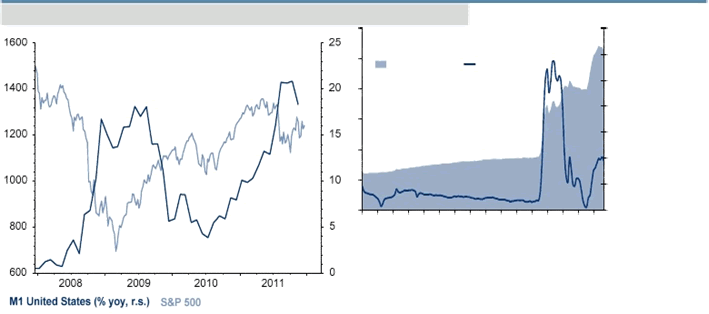
Take the following example on the left chart, where the dark blue line is the growth of Money Supply while the light blue line is the performance of the S&P 500. There is big expansion in the M1 since in early 2008 which preceded the rise of the S&P 500 which begin somewhere end of the year. This is because there is a time lag effect for monetary policy to work its way into the economy and normally it is by 6-8 months. Hence, this shows that the equity market movement is directly influence by the expansion in the Money Supply.
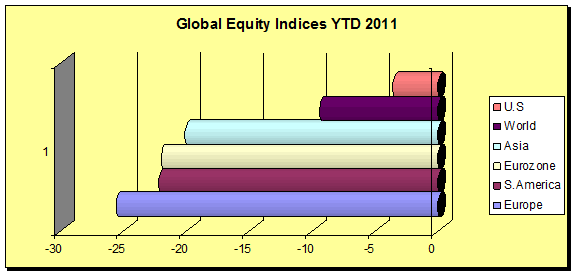
Again, the current sluggish expansion of money aggregates which contributed to the weak equity prices of the global market can best be described with the following chart. U.S is down 3.6%, World -9.4%, Asia -20.1%, DJEuroStoxx50 -22 %, South America - 22.2% and Europe -25.6%
However due to the recent concerted efforts by the world central banks on November 30 in Europe and the lowering of Statutory Deposit Ratio (SDR) in China during 2011, will help to boost liquidity and hence we will be seeing an uptrend in equity prices in the next few months.
To summarize, we are in favor that the equity market is somehow addicted to the Money Supply, an expansion in the Money supply will result in an upward movement of equities prices and a contraction in the Money Supply will lead to depress equities prices.
by Sam Chee Kong
cheekongsam@yahoo.com
© 2012 Copyright Sam Chee Kong - All Rights Reserved
Disclaimer: The above is a matter of opinion provided for general information purposes only and is not intended as investment advice. Information and analysis above are derived from sources and utilising methods believed to be reliable, but we cannot accept responsibility for any losses you may incur as a result of this analysis. Individuals should consult with their personal financial advisors.
© 2005-2022 http://www.MarketOracle.co.uk - The Market Oracle is a FREE Daily Financial Markets Analysis & Forecasting online publication.


