Silent Stock Market Crash in the Banking Sector
Stock-Markets / US Stock Markets Dec 22, 2007 - 07:59 PM GMTBy: Dominick
 There weren't many voices last weekend calling for a bullish reversal and rally in stocks. Come to think of it, were there any besides TTC at all? It seems that once again, just as in about the last dozen or so major market turns, this newsletter was alone in championing a bullish count while the entire online analysis community grew increasingly bearish and insisted the top was in. Now as a strong finish to the week puts us back within about 70 points of the all-time highs, bears are again forced to rethink their positions in the face of a market that threatens to grind higher through year-end and could still potentially explode upwards.
Remember the last update said: “The week closed with an obvious bearish head and shoulders pattern staring us in the face and we won't ignore it, but at the same time we won't put aside the bullish count that says we need to reverse and rally somewhere between here and the next forty points or so. If I'm right and we do get that reversal, that's going to be the big Santa Claus rally that takes us to new highs by early 2008 and I sure as anything don't want to be short when that happens!”
Sometimes head and shoulders are painted on the chart to be deceptive, since they're easy to spot and can get a lot of the more gullible traders on the wrong side of the move. In contrast, TTC called for a bullish reversal within 40 points of Friday's close. Considering that level was 1478 in the March ES contract and the Tuesday low was at 1445.50, a difference of 32.25 points, our outlook proved spot on! Frankly, if this kind of analysis isn't worth the price of admission to TTC, I don't know what you want. If it is – what are you waiting for? Members and nonmembers alike should be sure to read the bottom of this update for details on TTC's 2008 fee increase and other changes.
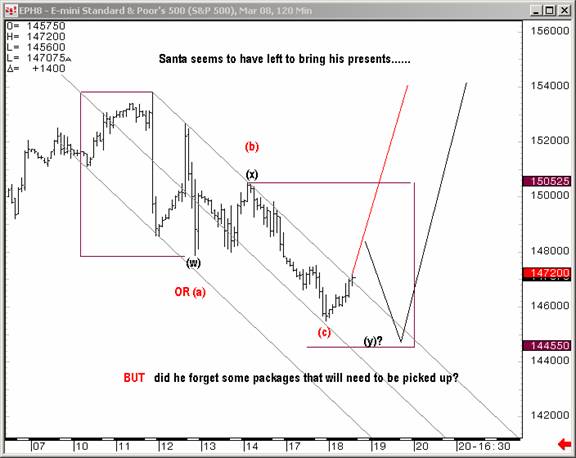
In the meantime, here's a sample of our work from the week that was. To start, the market gapped down on Monday and closed near the lows as expected. From the previous update, TTC was looking for support to put in a bottom while others were trading a wave 3 down, or the head and shoulders, both looking for an elusive crash in the major market indices. These bearish expectations were proved wrong, yet again, the following day, which opened with a 13 point gap higher. The globex chart below was posted in our daily forum just prior to the opening bell.

Our primary count was the black count, looking for a measured move from the previous peak. The count needed lower so we hesitated and didn't chase the morning rally. However, given the bullish price action and our larger picture expectation of a Santa Claus rally, we had to make allowance for the alternate count, in red, that would give us confirmation that the low was in and allow us to get safely onboard for the big move. This method would keep us from missing the bulk of the rally, frozen like a deer in the headlights as we waited for new lows that didn't materialize. But until that confirmation was in place, our buy target continued to be 1445.50 and aggressive members even faded the morning gap as it showed signs of stalling.
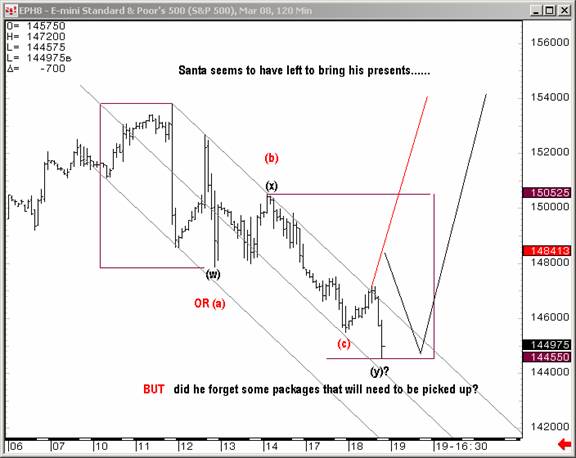
Sticking to our guns ultimately paid off as the market did in fact roll over and, as the chart below shows, bottomed at our target exactly to the tick. Though such perfect confirmation doesn't always happen, it certainly isn't the first time we've hit the number dead on, and I'd dare to say not the last.

The market rallied hard off that y bottom, giving TTC members the top and bottom ticks that day, worth over 40 points. Our projection off the low was to 1472, but as we approached the close, we began taking profits at 1468. Wednesday morning's trading got as high as about 1475 before vibrating around our 1472 level. With a little help from our relative strength indicator, which suggested the market had hit resistance, it was easy to get short once the market took out 1472. In all, the market would lose another 20 points into Thursday, beginning the process of what would become, as you will see, Friday's Santa Claus rally.
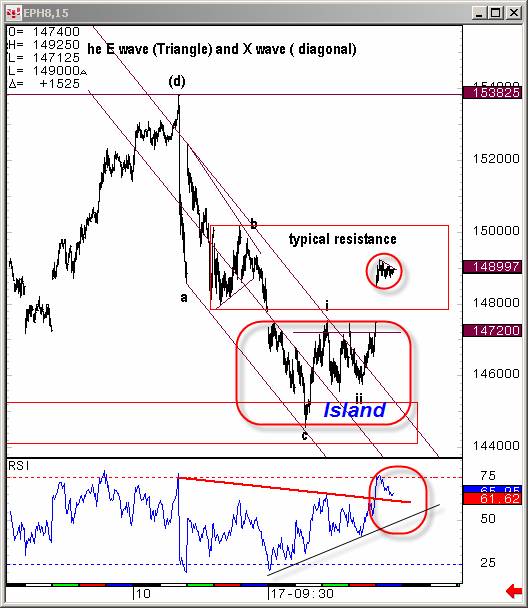
From Thursday's lows, it only took a modest bounce to get the market to close in the area of the gap at 1472. The rebound at the end of the day after a sharp selloff wasn't enough to get most buyers optimistic, but watching the charts, we knew it setup a perfect opportunity for gapping over the previous gap and creating an island reversal. Having gotten long the break of the ending diagonal that put in the Thursday low at about midday, members were advised to TMAR (take the money and run) if they didn't mind getting back in higher. Many chose to place buy stops in the overnight market to get a piece of the gap which looked like a high probability move going into Thursday's close. When Friday morning opened over 1478, the island reversal was in place and again the bears were trapped and forced to cover, launching the Santa Claus rally promised here last week.

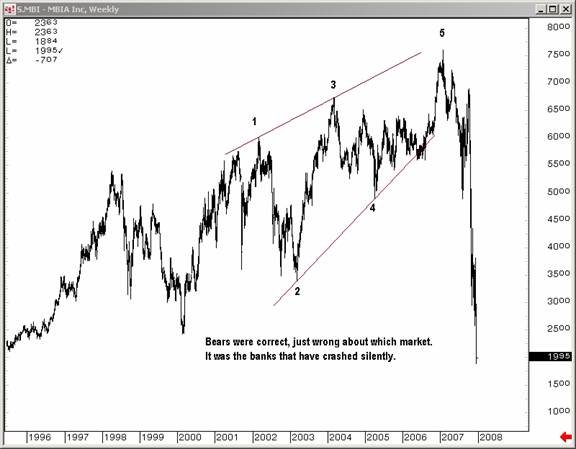
In all fairness, the bears have been right. There has been a major crash, only not in the market they expected. The chart below shows a textbook Elliott wave crash unfolding not in an intraday, but a weekly multi-year chart of mortgage insurer MBIA. While they've been looking for the major indices to fall off a cliff, they've gotten exactly what they were looking for, but limited to the financial sector. If there are committed bears who've been this selective, congratulations, but looking around the internet it seems the vast majority were looking for the end of the world and a meltdown in the S&P.

Obviously, the mortgage crisis has dominated the headlines for months now, so the crash isn't silent in that sense. But it's silent in that the major indices have not followed suit even though arguably they should have! The only reason they haven't: time and price are not yet right; My work doesn't show a complete pattern in the broader market.
If you look at a chart of the S&P it's not entirely unlike the MBIA chart if you shift it to the right two years. It's still potentially valid for the S&P to follow the banks and crash, but I don't see that yet at all. The fact that such a large part of the S&P has undeniably crashed and yet the larger index has maintained a bullish consolidation pattern signals strength and resilience in the overall market. Going into next year we're going to be watching for a bottom in the banks that holds because if money starts coming back into the financials then the S&P can shoot up like a missle, probably farther than you think possible at this point. But remember, this time last year I was promising volatility for 2007 as we hadn't seen in years. Going into '08, this volatility is not over and could even get wilder as we look for the light at the end of the tunnel in this financial sector train wreck.
Speaking of 2008, next year will be a milestone for TTC as we raise our monthly membership fee in February and look to close our doors to retail members sometime in the first half of the year. Institutional traders have become a major part of our membership and we're looking forward to making them our focus. If you're a retail trader/investor the only way to get in on TTC's proprietary targets, indicators, forums and real time chat is to join before the lockout starts, and if you join before February, you can still take advantage of the current low membership fee of $89. Once the doors close to retail members, the only way to get in will be a waiting list that we'll use to accept new members from time to time, perhaps as often as quarterly, but only as often as we're able to accommodate them.
To get you started I will run the refund offer again. . Subscribe by December 28th and stay for 7 days with full access to charts, chat and all TTC member privileges. At the end of your trial, if you're not satisfied, simply send me an email and I'll give you a full refund, no strings attached. It's that simple! There's no better value on the web than TTC and now there's no reason not to check it out for yourself. Click here to register for your free trial!
Our members continue to grow as a family of traders who easily get their money's worth month after month not only in terms of realized profits, but also in education and a sense of community. Bearish traders in particular have learned to overcome their previous losses, heal the psychological scars, and trade the huge upside potential of this market.
With only four more days left in the year, now is not the time to try and chase profits if you haven't reached your goals for the year. Instead, it's time to prepare ourselves for the big trends of 2008 and the hints from the market that will allow us to trade the smaller moves. I continue to think the S&P has one more high, that grains have room to go lower, that the dollar is only waiting for a major cycle in January to launch a surprise move to the upside and that gold has a move lower ahead of it (read Joe's Precious Points for more on the metals). But as you enjoy a happy holiday season, ask yourself if you'll be trading on emotion next year or smart risk/reward setups, on tried and true techniques or shaky analysis? Will you be trading someone's bearish bias, or trading the charts?
Merry Christmas to all!
ave a profitable and safe week trading, and remember:
“Unbiased Elliott Wave works!”
By Dominick
www.tradingthecharts.com
If you've enjoyed this article, signup for Market Updates , our monthly newsletter, and, for more immediate analysis and market reaction, view my work and the charts exchanged between our seasoned traders in TradingtheCharts forum . Continued success has inspired expansion of the “open access to non subscribers” forums, and our Market Advisory members and I have agreed to post our work in these forums periodically. Explore services from Wall Street's best, including Jim Curry, Tim Ords, Glen Neely, Richard Rhodes, Andre Gratian, Bob Carver, Eric Hadik, Chartsedge, Elliott today, Stock Barometer, Harry Boxer, Mike Paulenoff and others. Try them all, subscribe to the ones that suit your style, and accelerate your trading profits! These forums are on the top of the homepage at Trading the Charts. Market analysts are always welcome to contribute to the Forum or newsletter. Email me @ Dominick@tradingthecharts.com if you have any interest.
This update is provided as general information and is not an investment recommendation. TTC accepts no liability whatsoever for any losses resulting from action taken based on the contents of its charts, commentaries, or price data. Securities and commodities markets involve inherent risk and not all positions are suitable for each individual. Check with your licensed financial advisor or broker prior to taking any action.
Dominick Archive |
© 2005-2022 http://www.MarketOracle.co.uk - The Market Oracle is a FREE Daily Financial Markets Analysis & Forecasting online publication.


