


Stock Market Overbought But Entering Bullish Seasonal Period
Stock-Markets / US Stock Markets Dec 08, 2007 - 04:26 PM GMTBy: Mike_Burk

The good news is: The market has come off a bottom and seasonally next week has a very positive bias.
Short Term : The market is overbought.
In the 8 trading days from the Monday after Thanksgiving through last Thursday the S&P 500 (SPX) was up 7.2%. Some other indices were up even more, the Dow Jones Transports up 11.7%.
The chart below covers the past 6 months showing the S&P 500 (SPX) in blue and an indicator showing the SPX rate of change (ROC) over the past 10 trading days in black. Dashed vertical lines have been drawn on the 1st trading day of each month.
The indicator hit its highest level in over 4 years on Thursday.
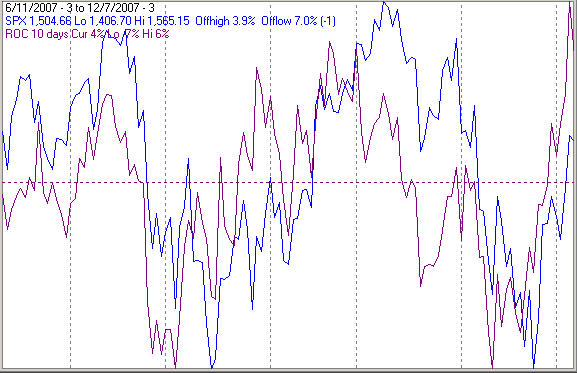
In the past when the indicator hit these levels coming off a bottom there was usually a pull back for a few days before the index continued to move upward.
Intermediate Term
New lows are the best indicator of bottoms.
After a bottom has been reached new lows diminish rapidly and that happened last week.
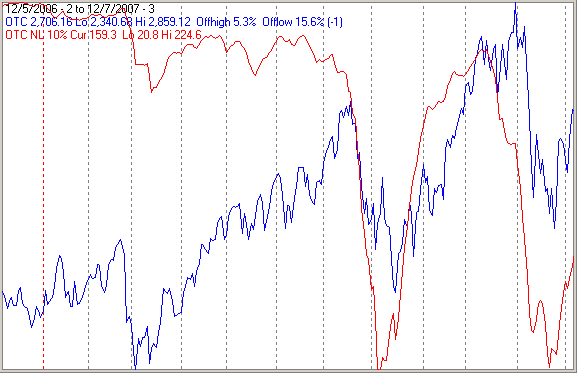
The first chart covers the past year showing the NASDAQ composite (OTC) in blue and a 10% trend (19 day EMA) of NASDAQ new lows (OTC NL) in red. OTC NL has been plotted on an inverted Y axis so increasing new lows moves the indicator downward (up is good).
The indicator has been moving sharply upward suggesting there is little risk right now.
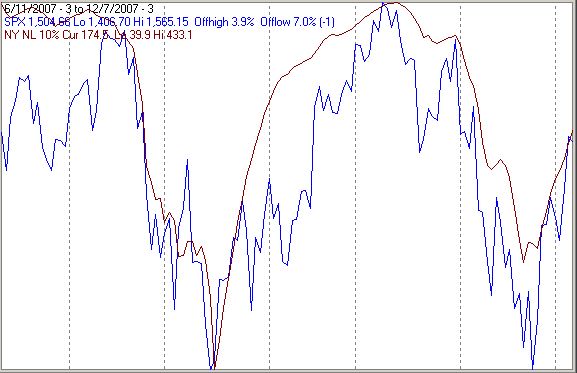
The next chart is similar to the one above except it covers the past 6 months and shows the SPX in blue and an indicator calculated from NYSE new lows (NY NL) in black.
When the SPX retested its August lows in late November the indicator was higher that it was during its August low (non-confirmation). NY NL has been moving sharply upward and there were only 30 new lows on the NYSE Friday, the lowest number since October 10.
Seasonality
Next week is the week prior to the 2nd Friday in December during the 3rd year of the Presidential Cycle.
The tables show the daily change of the OTC and SPX during the week prior to the 2nd Friday of December during the 3rd year of the Presidential Cycle. OTC data covers the period from 1963 - 2003 and SPX data from 1953 - 2003. Prior to 1953 the market traded 6 days a week so that data has been ignored. There are summaries for both the 3rd year of the Presidential Cycle and all years combined.
Historically this week has been very strong during the 3rd year of the Presidential cycle and weak in all of the other years.
The OTC has only been down once and the SPX down twice during the 3rd year of the Presidential cycle.
The averages over all years have been modestly positive only because of the very strong 3rd year.
Report for the week before the 2nd Friday of Dec
The number following the year is the position in the presidential cycle.
Daily returns from Monday to 2nd Friday.
| OTC Presidential Year 3 | ||||||
| Year | Mon | Tue | Wed | Thur | Fri | Totals |
| 1963-3 | -0.25% | 0.14% | 0.26% | 0.25% | -0.37% | 0.03% |
| 1967-3 | 0.87% | 0.99% | 0.47% | 0.37% | 0.09% | 2.79% |
| 1971-3 | -0.32% | 0.32% | 0.42% | 0.24% | 0.78% | 1.44% |
| 1975-3 | 0.27% | -0.53% | 0.98% | -0.23% | -0.23% | 0.26% |
| 1979-3 | 0.33% | -0.09% | 0.46% | 0.31% | 0.71% | 1.71% |
| 1983-3 | -0.50% | -0.16% | 0.04% | -0.56% | -0.02% | -1.20% |
| Avg | 0.13% | 0.10% | 0.47% | 0.03% | 0.27% | 1.00% |
| 1987-3 | 0.63% | 1.08% | 1.34% | -0.38% | 0.59% | 3.26% |
| 1991-3 | -0.18% | -0.21% | -0.48% | 0.82% | 0.91% | 0.86% |
| 1995-3 | 1.37% | -0.36% | -0.39% | -0.80% | 0.87% | 0.69% |
| 1999-3 | 0.72% | 1.15% | -0.02% | 0.23% | 0.72% | 2.80% |
| 2003-3 | 0.57% | -2.08% | -0.19% | 1.98% | 0.34% | 0.62% |
| Avg | 0.62% | -0.08% | 0.05% | 0.37% | 0.69% | 1.65% |
| OTC summary for Presidential Year 3 1963 - 2003 | ||||||
| Avg | 0.32% | 0.02% | 0.26% | 0.20% | 0.40% | 1.21% |
| Win% | 64% | 45% | 64% | 64% | 73% | 91% |
| OTC summary for all years 1963 - 2006 | ||||||
| Avg | 0.05% | 0.14% | -0.04% | -0.31% | 0.23% | 0.08% |
| Win% | 59% | 52% | 51% | 48% | 57% | 52% |
| SPX Presidential Year 3 | ||||||
| Year | Mon | Tue | Wed | Thur | Fri | Totals |
| 1955-3 | 0.57% | 0.00% | -0.33% | 0.59% | 0.15% | 0.99% |
| 1959-3 | 0.19% | 0.64% | -0.62% | 0.08% | -0.24% | 0.06% |
| 1963-3 | -0.05% | 0.04% | -0.12% | 0.01% | 0.20% | 0.08% |
| 1967-3 | 0.63% | 0.14% | 0.43% | -0.12% | -0.12% | 0.97% |
| 1971-3 | -0.57% | 0.37% | 0.05% | 0.04% | 0.75% | 0.65% |
| 1975-3 | 0.29% | 0.26% | 0.89% | -0.32% | 0.03% | 1.16% |
| 1979-3 | 0.14% | -0.17% | 0.03% | 0.14% | 1.16% | 1.30% |
| 1983-3 | 0.20% | -0.18% | 0.27% | -0.43% | -0.07% | -0.21% |
| Avg | 0.14% | 0.09% | 0.33% | -0.14% | 0.35% | 0.78% |
| 1987-3 | 2.16% | 2.69% | 1.69% | -2.23% | 0.75% | 5.07% |
| 1991-3 | -0.22% | -0.10% | -0.05% | 1.02% | 0.77% | 1.41% |
| 1995-3 | 1.10% | 0.65% | 0.40% | -0.65% | 0.21% | 1.73% |
| 1999-3 | -0.69% | -1.00% | -0.38% | 0.30% | 0.64% | -1.13% |
| 2003-3 | 0.73% | -0.85% | -0.11% | 1.15% | 0.27% | 1.20% |
| Avg | 0.62% | 0.28% | 0.31% | -0.08% | 0.53% | 1.66% |
| SPX summary for Presidential Year 3 1955 - 2003 | ||||||
| Avg | 0.35% | 0.21% | 0.17% | -0.03% | 0.35% | 1.02% |
| Win% | 69% | 58% | 54% | 62% | 77% | 85% |
| SPX summary for all years 1953 - 2006 | ||||||
| Avg | 0.11% | 0.10% | -0.01% | -0.26% | 0.22% | 0.17% |
| Win% | 57% | 47% | 49% | 39% | 67% | 54% |
Mutual Fund
Compliance issues demand that I not mention the mutual fund that I manage by name or symbol in this letter.
To see a current chart of the fund go to: http://finance.yahoo.com/q/bc?s=APHAX&t=6m&l=on&z=m&q=l&c= .
For information about the fund go to: http://www.thealphafunds.com/index.htm . The fund now has service class shares available.
Conclusion
The market is overbought and likely to stall for a few days before continuing to move upward.
I expect the major indices to be higher on Friday December 14 than they were on Friday December 7.
Thank you,
By Mike Burk
To subscribe to this report : http://alphaim.net/signup.html
Gordon Harms produces a Power Point for our local timing group. You can get a copy of that at: http://www.stockmarket-ta.com/ .
Disclaimer: Mike Burk is an employee and principal of Alpha Investment Management (Alpha) a registered investment advisor. Charts and figures presented herein are believed to be reliable but we cannot attest to their accuracy. Recent (last 10-15 yrs.) data has been supplied by CSI (csidata.com), FastTrack (fasttrack.net), Quotes Plus (qp2.com) and the Wall Street Journal (wsj.com). Historical data is from Barron's and ISI price books. The views expressed are provided for information purposes only and should not be construed in any way as investment advice. Furthermore, the opinions expressed may change without notice.
Mike Burk Archive |
© 2005-2022 http://www.MarketOracle.co.uk - The Market Oracle is a FREE Daily Financial Markets Analysis & Forecasting online publication.