


The "Great Depression" and the "Great Recession" FAQ
Economics / Economic Depression Aug 23, 2011 - 04:43 AM GMTBy: Asha_Bangalore

 There have been frequent questions from clients and partners about the “Great Depression” and the recent recession, which is often called the “Great Recession.” Here are five important aspects that should help to put the two periods in historical perspective.
Q1 What is the duration of these two downturns in economic activity?
A1. The Business Cycle Dating Committee of the National Bureau of Economic Research identifies the periods of recessions and expansions in the U.S. economy. The Great Depression had two distinct periods of a decline in economic activity, one more severe than the other in terms of both the duration and depth of the recession. The first leg of the Great Depression was from August 1929 to March 1933, which is a 43-month experience; the second leg spanned a 13-month period from May 1937 to June 1938. The Great Recession has been identified as stretching from December 2007 to June 2009, a total of 18 months. As a frame of reference, the median duration of recessions in the post-war period has been 10 months.
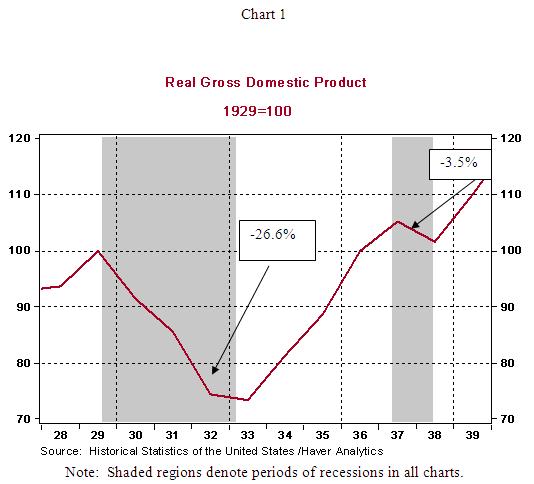
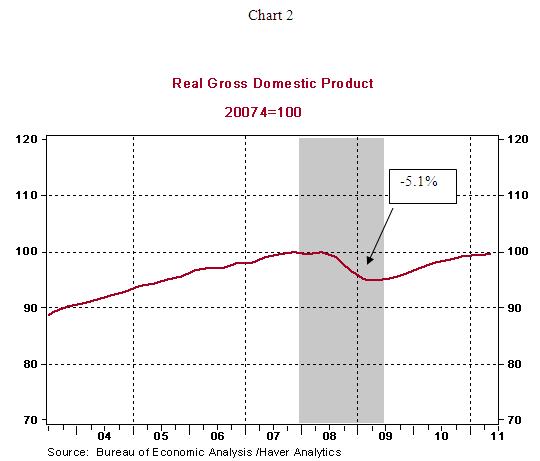
Q2. What is the magnitude of the decline in real GDP during these two periods?
Real GDP plunged 26.6% during 1929-33 but posted a smaller decline of 3.5% during the 1937-38 recession (see Chart 1). [Charts 1 and 2 are indexed charts where the level of real GDP at the peak of the business cycle is set equal to 100. A reading of 96 would mean that real GDP has dropped 4% from the peak and 102 would stand for a 2.0% increase in real GDP from the peak.] By contrast, more recently, real GDP has dropped 5.1% from peak to trough during December 2007-June 2009 (see Chart 2). These numbers indicate that the extent of the drop in real GDP this time around has been significantly smaller than during the Great Depression.
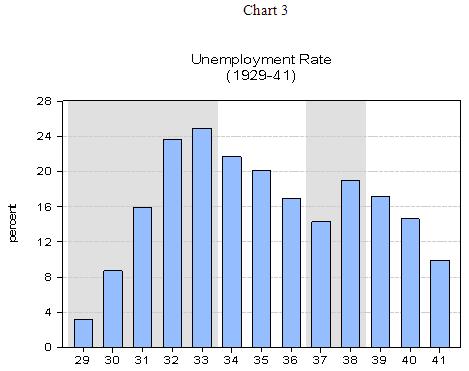
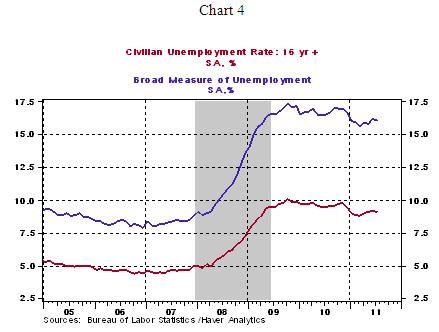
Q3. What was the unemployment rate during the Great Depression? Has the labor market suffered a similar deterioration this time around?
The unemployment rate during the Great Depression hit a high mark of 24.9% in 1933 (Chart 3) when roughly 12.8 million people were out of jobs. This time around, the peak of the jobless rate was 10.1% in October 2009 and holding at 9.1% in July 2011. If folks who are working part-time but want full-time jobs and those marginally attached to the labor force are considered unemployed, the jobless rate peaked at 17.1% in September 2009 (see Chart 4). Based on these numbers, the labor market setback is also smaller now compared to the 1930s.
Source: Labor Force, Employment, and Unemployment 1929-39, Estimating Methods, Monthly Labor Review, July 1948
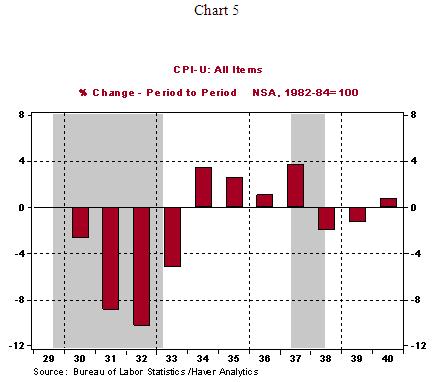
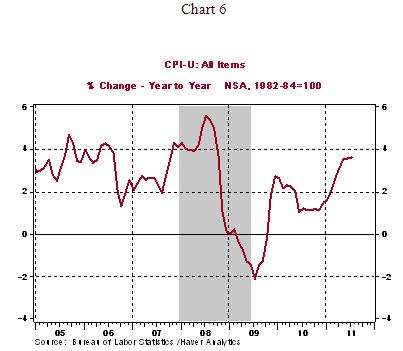
Q4. What was the extent of deflation in the Great Depression? Did the U.S. economy experience a deflation in the Great Recession?
The Consumer Price Index (CPI) fell during 1930-33 and again in 1938-39 (see Chart 5). A deflationary experience of this nature has not been occurred in the US during the entire post-war period, with the exception of 2009 (see Chart 6). The Fed’s aggressive and innovative monetary policy measures put in place during 2007-2011 were to a large extent to prevent another deflationary episode in the US economy. The Fed has succeeded in containing deflation to a single year this time around, mainly because it drew valuable lessons from its 1930s experience.
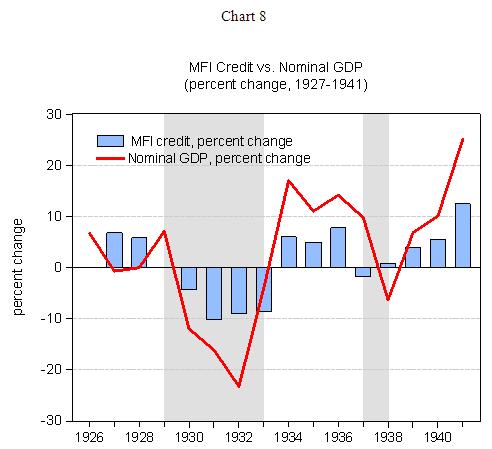
Q5. We have written extensively about the importance of tracking Monetary Financial Institution (MFI) credit in the economy (sum of Fed credit and bank credit) to establish if self-sustained economic growth will be in place. How did Fed and bank credit perform during the Great Depression?
Loans and investments of all banks (bank credit) fell each year from 1930-1933 and once again in 1937, while Fed credit fell in 1929 and 1930 and rose slightly during 1931-33 (see Chart 7). The significant drop in bank credit is what stands out during this period (see Chart 7). Consequently, the sum of bank and Fed credit, MFI, fell during both phases of a decline in economic activity of the Great Depression (see Chart 8). Our view about MFI credit is that, historically, it explains a large part of the growth in GDP. The monthly U.S. commentaries of March 2011 (To QE or Not to QE? That is the Question) and April 2011(The Fed Terminates QE1, We Lower Our GDP Forecast) explain this relationship in detail. The main takeaway, as mentioned earlier, is that a drop in MFI is also associated with a decline in GDP during the Great Depression (see Chart 8).
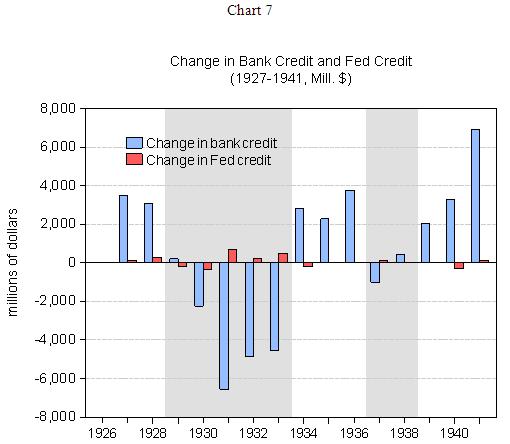
Source: Data plotted in Charts 7 and 8 are from Banking and Monetary Statistics 1914-1941.
Asha Bangalore — Senior Vice President and Economist
http://www.northerntrust.com
Asha Bangalore is Vice President and Economist at The Northern Trust Company, Chicago. Prior to joining the bank in 1994, she was Consultant to savings and loan institutions and commercial banks at Financial & Economic Strategies Corporation, Chicago.
Copyright © 2011 Asha Bangalore
The opinions expressed herein are those of the author and do not necessarily represent the views of The Northern Trust Company. The Northern Trust Company does not warrant the accuracy or completeness of information contained herein, such information is subject to change and is not intended to influence your investment decisions.
© 2005-2022 http://www.MarketOracle.co.uk - The Market Oracle is a FREE Daily Financial Markets Analysis & Forecasting online publication.