


Seven Reasons to Sell your Stock Market Portfolio
Stock-Markets / US Stock Markets Feb 02, 2007 - 11:38 AM GMTBy: Paul_Lamont

We have pinpointed the seven reasons why investors should be currently selling their stock and mutual fund portfolio. As Marc Faber has been saying recently: "In a selling panic you should buy, but in the buying mania that we have now the wisest course of action is to liquidate." After discussing reasons to sell, we will recommend what steps you should take with your cash to protect value. But first, the 7 reasons:
1. Sentiment
Sentiment surveys allow an investor to gauge the emotional enthusiasm of the market. The Daily Sentiment Index from MBH Commodities has been tracking the percentage of bulls and bears for 19 years. In mid-December, this survey recorded its highest long-term bullish reading ever. We called Jake Bernstein, President of MBH Commodities, to personally confirm these numbers. More traders are bullish towards the S&P 500 (91%) than at the peak of the NASDAQ in 2000 (83%). Remember delusional investors were buying tech "ideas" in 2000. Now there is even more consensus that markets can only go higher (see below). This suggests a major correction.
In addition, all 14 "Strategists" at the largest Wall Street Firms are calling for a higher market in 2007. The last time this bullish consensus occurred was at the start of 2001. The DJIA subsequently fell ~40% over the next 2 years.
"A pack of lemmings looks like a group of rugged individualists compared with Wall Street when it gets a concept in its teeth." - Warren Buffet
2. Insider Selling
Corporate insiders (see chart below) are selling shares in their companies at the highest rate in over 10 years. In fact according to Elliotwave.com, it"s the highest rate since right before the crash of 1987. Executives are the most knowledgeable people about the future prospects of their companies. If they are selling, then why should you be holding shares of their companies?
3. Mutual Fund Cash
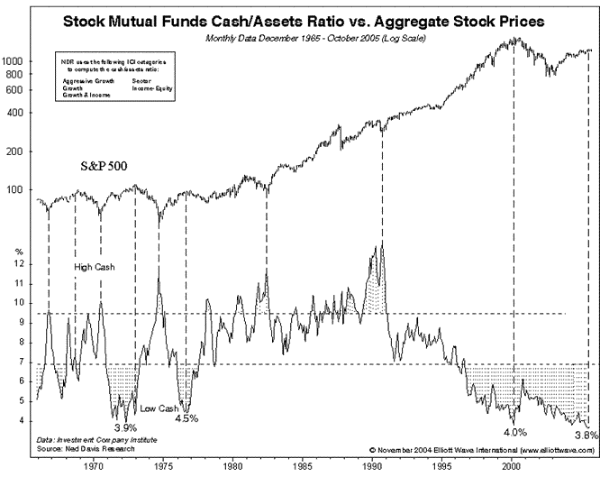
Mutual fund managers are not immune from the emotions of the market. Due to the long term record of their positions, we can inspect their behavior at significant market turns. Looking at the chart above, mutual fund managers hold little cash in their funds at market tops and large amounts at bottoms. This of course is the opposite of what a wise investor should be doing, but fortunately it gives us a reliable contrarian indicator. Notice that mutual fund managers are presently holding the least amount of cash in 33 years.
4. Dow Theory Sell Signal
Dow Theory is used by market technicians to study the health of the overall trend by comparing the Dow Industrial, Utility, and Transportation indexes. To summarize, if the historical Dow indexes are rallying together, then the trend is healthy. If an index is left behind, such as is occurring now, then it is described as a "broken" market and warns of future weakness. The chart below from Tim Wood, one of the most studied on the subject of Dow Theory, shows that the indexes have been diverging for the last 6 months. The chart also shows the successful forecast for weakness in 2000.
5. Inverted Yield Curve
The chart above, from Agora Financial's Survival Report, shows an inverted yield curve (short term rates are higher than long term rates) implying that investors expect a slowdown in growth in the future. According to the Federal Reserve, the inverted yield curve "has borne a consistent negative relationship with subsequent real economic activity in the United States, with a lead time of about four to six quarters....The yield curve has predicted essentially every U.S. recession since 1950 with only one "false" signal, which proceeded the credit crunch and slowdown in production in 1967." Recently, the inverted yield curve warned investors in mid-2000 of the coming market decline. It has now been constantly inverted since mid-2006.
6. 20 Year Cycle Stretches the 4 Year Cycle
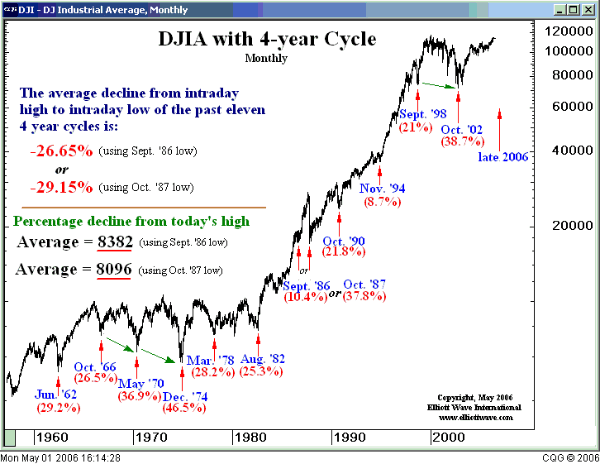
The emotional investing herd fluctuates from greed to fear, creating cycles through time. The most correlative rhythm to the Dow Jones Industrial Average is the 4 year cycle. The chart above shows the reoccurrence of this notable low every 4 years. Notice the overdue sell-off expected in late 2006. Only one other year in this fifty year stretch has the cycle extended past schedule: 1987. It seems history is repeating. A sensible explanation would be that a larger cycle was coming to conclusion, influencing the market to extend past this 4 year rhythm. Our recent research of the 20 year crash cycle lends evidence to this theory.
 |
$9 (50% discount) |
176 1 178 1 180 1
181 7 183 7 185 7
187 3 189 3 191 3
192 9 194 9 196 9
198 7 200 7 ? 202 7 ?
After 1969, an odd thing occurred. There was no crash in 1985, as predicted by this cycle: 1969 + 16. Analysts would also have expected the smaller 4 year cycle to appear in 1986. Instead the market rose into 1987, crashing that autumn almost 40%. We are now coming upon the 20 year anniversary of the 1987 crash. We believe the 4 year cycle is again extending to align with the larger 20 year cycle much like it did in 1987, to produce a significant downdraft this year.
The year 2007 also marks the 10th anniversary (1/2 cycle of 20yr) of the 1997 Asian Crisis. As another example, the Japanese market topped in 1990, ten years before the U.S. markets in 2000. The Nikkei 225 Index is still below half of its peak value.
7. Low Volatility
Over the last few years, there has been a complete collapse in volatility in the stock market. Generally, volatility drops when markets rise and increases when investors nervously sell shares. Low volatility warns investors of an environment rife with complacency and lack of fear (which is needed for markets to rise). As you can see from the chart above from Tim Wood, the Volatility Index or "fear index" is at 13 year lows. We believe that volatility will return to the market this year with the downward pull of the 4 and 20 year cycles.
Why Selling Is The Hardest Part?
In "Hard-wired to Fail: Why We Need Contrarian Managers" Doug Wakefield, President of Best Minds Inc., explains the influence of emotion in investing;
"In short, the basal ganglia and limbic system are the parts of the brain that guide the behaviors that are required for self-preservation, and since money is something we need to survive, these emotional and instinctual forces exert a very strong influence on our investment decisions. To make matters worse, research shows that these two parts of the brain do not learn from experience. Also, since flocking or herding is part of the self-preservation dynamic in mammals, going against the crowd is completely unnatural. This is why it is easy to intellectually agree with Buffet's or Templeton's admonitions to invest oppositely of the crowd, and so extremely difficult to actually do it."
" Capitalism demands the best of every man- his rationality -and rewards him accordingly. " - Ayn Rand
Investors have been emotionally conditioned (and rewarded) during their entire investing careers by buying and holding stocks. Unfortunately, market trends and valuations change. "Buy and Hold" was also the mantra in the late 1920"s. Therefore we hope you are able to shrug off the need to follow the crowd, look at the evidence rationally, and protect your assets.
What To Do
In a credit crunch, optimism turns to fear, risk is re-priced, and the rush to liquidate assets begins. Prices fall and cash is the only haven of value. This is what happened from 2000 to 2002. The same will happen soon and will surely happen again in the future. With the cash you have raised from selling assets, we recommend a portfolio of 3 month U.S. Treasury Bills, which protect principal. We do provide this service, but we want to stress that you can call your financial consultant tomorrow to allocate everything into a U.S. Government-only money market fund. While this is not ideal, it will initially protect investors, until more evidence demands further preservation and our services. History shows that most investors will not take action, but those that do, will be able to eventually buy assets at bargain prices.
By
Paul Lamont
www.LTAdvisors.net
At Lamont Trading Advisors, Inc. we specialize in the management of risk and preservation of wealth. Visit our Current Strategy section for information on our asset allocation recommendations or Contact Us if you would also like to be notified when our investment analysis reports are published.
Lamont Trading Advisors, Inc. was founded on February 3rd, 2004 in New York City. After extensive research in market behavior, investor pyschology, and financial history, President Paul J. Lamont realized the need for an investment management firm focused on wealth preservation over the next decade. In July 2005, Lamont Trading Advisors was relocated to 502 Bank Street in Decatur, Alabama. On May 1st, 2006, investment advisor registration with the State of Alabama was granted. ***No graph, chart, formula or other device offered can in and of itself be used to make trading decisions.
© 2005-2022 http://www.MarketOracle.co.uk - The Market Oracle is a FREE Daily Financial Markets Analysis & Forecasting online publication.