Stock Market Long-Term Bull Trend Still Intact
Stock-Markets / US Stock Markets Nov 29, 2007 - 07:20 AM GMTBy: Mike_Paulenoff
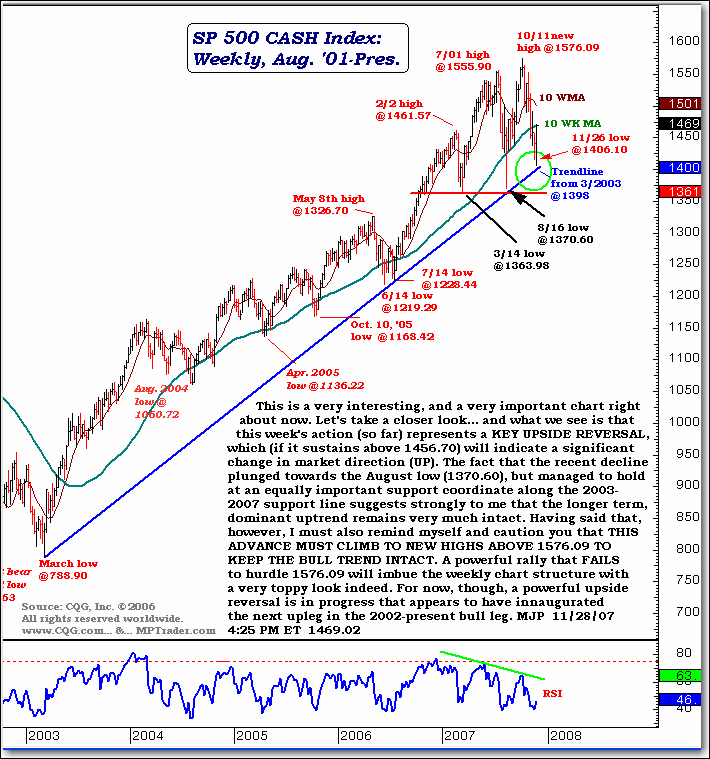
This is a very interesting and important chart right about now. Let's take a closer lookŠand what we see is that this week's action (so far) represents a key upside reversal, which, if the S&P 500 sustains above 1456.70, will indicate a significant change in market direction (UP).
The fact that the recent decline plunged towards the August low (1370.60)
but managed to hold at an equally important support coordinate along the
2003-07 support line suggests strongly to me that the longer-term dominant
uptrend remains very much intact.
Having said that, however, I must also remind myself and caution you that this advance must climb to new highs above 1576.09 to keep the bull trend intact. A powerful rally that fails to hurdle 1576.09 will imbue the weekly chart structure with a very toppy look indeed.
For now, though, a powerful upside reversal is in progress that appears to have inaugurated the next upleg in the 2002-present bull leg.

Sign up for a free 15-day trial to Mike's ETF Trading Diary today.
By Mike Paulenoff
Mike Paulenoff is author of the MPTrader.com (www.mptrader.com) , a real-time diary of Mike Paulenoff's trading ideas and technical chart analysis of Exchange Traded Funds (ETFs) that track equity indices, metals, energy commodities, currencies, Treasuries, and other markets. It is for traders with a 3-30 day time horizon, who use the service for guidance on both specific trades as well as general market direction
© 2002-2007 MPTrader.com, an AdviceTrade publication. All rights reserved. Any publication, distribution, retransmission or reproduction of information or data contained on this Web site without written consent from MPTrader is prohibited. See our disclaimer.
Mike Paulenoff Archive |
© 2005-2022 http://www.MarketOracle.co.uk - The Market Oracle is a FREE Daily Financial Markets Analysis & Forecasting online publication.


