How Central Bankers are Stealing Your Money - Money Supply Inflation
Economics / Analysis & Strategy Feb 01, 2007 - 09:30 AM GMTYou've heard me say it many times before: Without a gold standard, central bankers are free to print money and credit like crazy to inflate their economies … avoid recessions … and to pay off governmental debts.
The problem with this is that it's always done at your expense! Central bankers don't suffer the consequences. Neither do those in the government. But you sure do!
The purchasing power of your currency declines …
Your cost of living rises …
And you work harder only to end up with diminishing returns on your labor and capital.
In effect, central bankers are stealing your money! That's why it's critical to invest in tangible assets that represent real wealth. More on that in a moment. First, let me explain the problem a little more:
Money Supply Is Surging Around the World …
Check out my table. You can see that the supply of money and credit in India is growing at an astronomical 20% a year!
| Country | Money Supply Growth (Annualized) |
| India | 20.0% |
| China | 16.9% |
| Australia | 11.2% |
| Britain | 14.2% |
| Canada | 8.6% |
| Denmark | 9.1% |
| Japan | 0.7% |
| Sweden | 10.6% |
| Switzerland | 2.4% |
| United States | 4.8% |
| Euro Area | 8.5% |
In China, it's rising 16.9% annually.
In the European Union, the growth in the broad supply of money recently hit its highest level in 17 years.
And Australia and Britain aren't far behind at 11.2% and 14.2%, respectively.
Now, money supply growth in the U.S. looks tame by comparison, rising at an annual rate of 4.8%.
But based on the inflation we're already seeing in the U.S. — in commodity prices and previously in real estate — I don't trust the U.S. figures one iota. And neither should you. Why?
Washington Is Playing Games With Its Money Supply Figures
In the past, I've told you how Washington manipulates the Consumer Price Index by intentionally leaving out energy and food costs. The reasoning behind this is simple: A lot of government entitlements (such as Social Security) are tied to the CPI rate. So Washington tries to limit the increases in benefits it's obligated to pay by deceiving you on the real rate of inflation.
Recently, they've been pulling even dirtier tricks with their money supply figures — by not releasing them anymore! That's right — last March, Washington stopped publishing statistics on the important measure of money supply known as M-3.
M-3 is the broadest measure of money supply, and includes:
- All coins and paper bills
- Demand deposits (checking accounts), NOW accounts, travelers' checks, ATS accounts, and credit union share drafts
- Savings deposits of $100,000 or less
- Large time deposits (CDs), Money Market Deposit Accounts, and money market mutual fund shares owned by individual investors
- Plus, Eurodollars held by U.S. residents at foreign branches of U.S. banks and at all banks in the United Kingdom and Canada.
Important: We are the only industrialized country that has ceased publishing the broad M-3 money supply measure!
The European Central Bank (ECB) uses its version of the M-3 as its preferred measure. China uses its broad M-2, the equivalent of M-3.
Ditto for Japan. And the Bank of England publishes its broad money supply as “M-4.”
So why did the Federal Reserve stop publishing the M-3 on March 23, 2006?
They said it would save them money. And that the measure was redundant since they track all the money in the economy via other indicators.
My view: That's a bunch of hogwash! This is just another attempt to pull the wool over your eyes on inflation.
Any analyst worth their weight knows that inflation and the broad money supply are very tightly integrated. So, by hiding the money supply figure, Washington is giving us one less way to assess inflation.
Consider the facts:
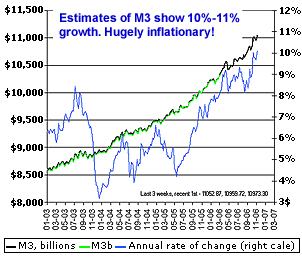
Fact: Just before the Fed stopped publishing the M-3 data last March, it was surging at an annualized rate of 9.4% for the previous three months and had rocketed an amazing 17.2% in December 2005.
Fact: The increase in the broad money supply generally tracked the increase in the total U.S. debt, eliminating any discrepancies when the budget deficit and the total debt didn't jibe. Last year, the official budget deficit was $320 billion, but the total national debt rose by $555 billion. The difference was effectively borrowed from Social Security trust funds, but because M-3 wasn't being published, a $235 billion increase in the money supply was never shown to the public.

Fact: Other reliable measures of the broad money supply show incredible surges since the government stopped publishing M-3. The average monthly growth between April and December of last year is a staggering 9.48%, implying an inflation rate near 10%!
Consider Stocking up on
More Inflation Hedges
Once you realize that the true U.S. supply of money is rising in excess of 9%, it's easy to see that inflation is going to rise in 2007, no matter what anyone else tells you.
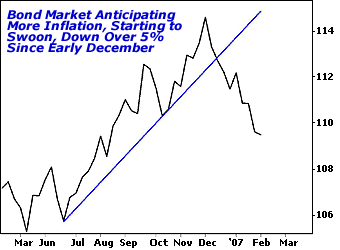
The bond market is already starting to anticipate higher inflation — bond prices are falling and interest rates are rising … just like I told you they would.

Make no mistake: The plunge in the bond market is a surefire sign that the supply of money is increasing … that the paper dollars in your wallet are going to be worth less … and that more inflation is on the way.
This is why I suggest staying invested primarily in inflation hedges — tangible assets that do well in this kind of environment. Real estate is the only exception because I don't think prices have bottomed yet.
And, in my view, gold is the best hedge of them all. Here's why …
The dollars in your wallet could lose an estimated 50% of their purchasing power, perhaps even more. The same applies to most paper assets. Gold, on the other hand, should more than double from its current price of $650 to well over $1,300 an ounce. Select gold mining shares should do even better. For my latest recommendations, see the current issue of my Real Wealth Report .
by Larry Edelson
P.S. If you're not yet a Real Wealth Report subscriber, you can get a one-year subscription for just $99 right now . That includes 12 hard-hitting monthly issues, flash alerts, 24/7 website access, and more.
This investment news is brought to you by Money and Markets. Money and Markets is a free daily investment newsletter from Martin D. Weiss and Weiss Research analysts offering the latest investing news and financial insights for the stock market, including tips and advice on investing in gold, energy and oil. Dr. Weiss is a leader in the fields of investing, interest rates, financial safety and economic forecasting. To view archives or subscribe, visit http://www.MoneyandMarkets.com
© 2005-2022 http://www.MarketOracle.co.uk - The Market Oracle is a FREE Daily Financial Markets Analysis & Forecasting online publication.


