U.S. Employment Situation Deteriorates as Hiring Slows and Unemployment Rate Rises to 9.1%
Economics / Employment Jun 04, 2011 - 11:42 AM GMTBy: Asha_Bangalore
 Civilian Unemployment Rate: 9.1% in May vs. 9.0% in April. Cycle high for recession is 10.1% in October 2009.
Payroll Employment: +54,000 in May vs. +232,000 in April. Private sector jobs increased 83,000 after a gain of 251,000 in April.
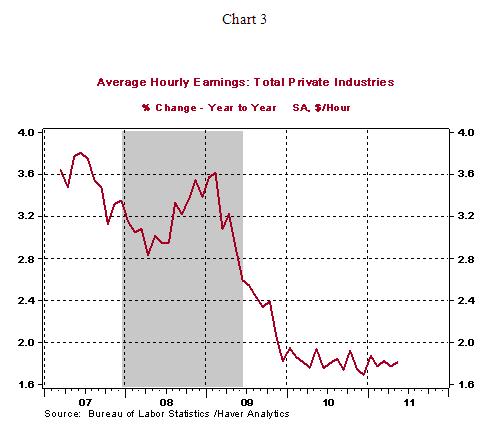
Private Sector Hourly Earnings: $22.98 in May vs. $22.92 in April; 1.8% yoy increase in May, matches increase posted in April.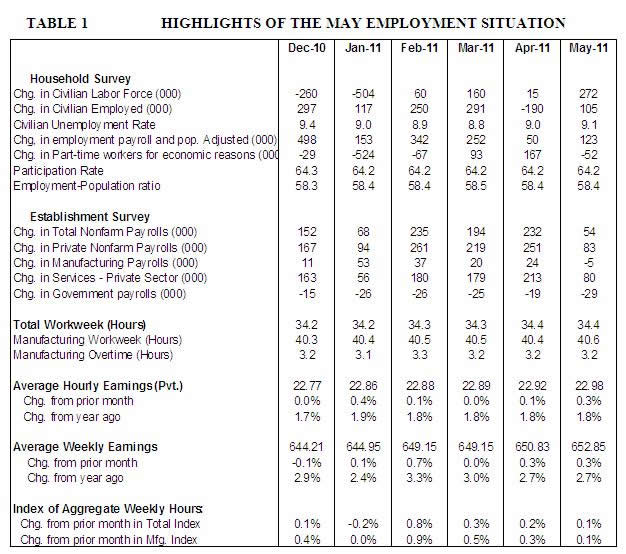
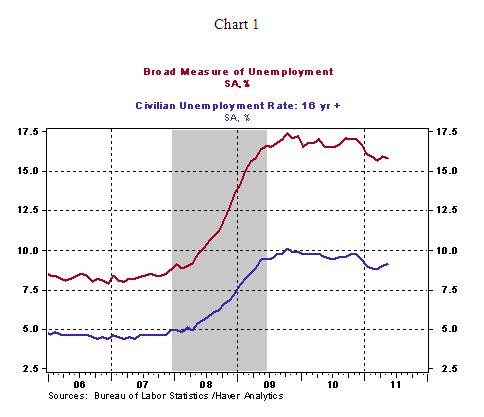
Household Survey - The unemployment rate moved up one notch to 9.1% in May from 9.0% in April. Employment (+105,000) increased in May but the labor force (+272,000) recorded the largest increase since August 2010 and raised the jobless rate. The participation rate has held steady for five straight months at 64.2%. The broader measure of unemployment (inclusive of the marginally attached and involuntary part-time workers who are unable to find full-time employment) edged down to 15.8% in May from 15.9% in the prior month.
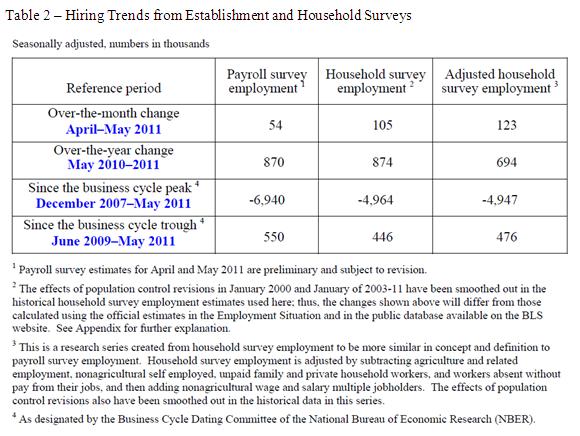
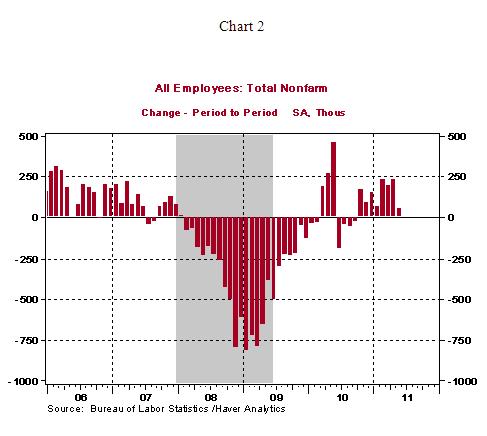
Establishment Survey - Nonfarm payrolls increased only 54,000 in May, after a downwardly revised gain of 232,000 in April. Private sector employment slowed to an increase of 83,000 following an average gain of 244,000 in the three months ended April. The Bureau of Labor Statistics publishes a comparison of employment changes under the two different surveys to enable an apples-to-apples comparison (see Table 2 below). The main conclusion from these numbers is that gain in employment needs to be more robust and consistent to assert that self-sustained growth is here.
Source: http://www.bls.gov/web/empsit/ces_cps_trends.pdf
In May, the workweek held steady at 34.4 hours and temporary jobs (-1,200) fell slightly. Both of these indicators bode negatively for the near term employment outlook because firms extend hours and increase temporary payrolls before hiring on a permanent basis. The drop in factory employment (-5,000), the first since October, and losses of local government jobs (-28,000) are other worrisome aspects of the report.
Highlights of changes in payrolls during May 2011:
Construction: +2,000 vs. +5,000 in April
Manufacturing: -5,000 vs. +24,000 in April
Private sector service employment: +80,000 vs. +213,000 in April
Retail employment: -9,000 vs. -64,000 in April
Professional and business services: +44,000 vs. +50,000 in April
Temporary help: -1,200 vs. -1,600 in April
Financial activities: -2,000 vs. +3,000 in April
In May, average hourly earnings increased by 6 cents, or 0.3%, to $22.98, putting the year-to-year increase at 1.8%. The decelerating trend of hourly earnings is indicative of the absence of wage pressures. The tepid gain in payrolls combined with earnings data suggests a moderate increase in the wage and salary component of personal income during May. The supply chain problems of the auto industry is part of the reason for a likely flat reading of factory production in May, in addition to the overall slowing trend in factory activity visible in the ISM manufacturing survey.
Conclusion - Economic reports for May (auto sales, employment and ISM manufacturing) and April data of consumer spending, factory production, housing starts, sales of existing homes, and prices of homes send an unified message of an economy shifting to a lower gear of operation even before the Fed has completed QE2 (quantitative easing 2). There are special factors such as supply chain issues from Japan's natural disaster, high energy costs, and bad weather in the United States that have played a role in the weak employment numbers. Despite these considerations, the details of the report suggest that the pace of hiring has weakened for the most part. The fact that there are dissenters within the FOMC, who view the Fed's balance sheet with alarm and would prefer to tighten monetary policy, and Chairman Bernanke's indication that the hurdle for additional financial accommodation (QE3) is "high" imply that the Fed is most likely to watch and wait after QE2 is completed. Chairman Bernanke would need an air tight case from economic reports to justify QE3.
Asha Bangalore — Senior Vice President and Economist
http://www.northerntrust.com
Asha Bangalore is Vice President and Economist at The Northern Trust Company, Chicago. Prior to joining the bank in 1994, she was Consultant to savings and loan institutions and commercial banks at Financial & Economic Strategies Corporation, Chicago.
Copyright © 2011 Asha Bangalore
The opinions expressed herein are those of the author and do not necessarily represent the views of The Northern Trust Company. The Northern Trust Company does not warrant the accuracy or completeness of information contained herein, such information is subject to change and is not intended to influence your investment decisions.
© 2005-2022 http://www.MarketOracle.co.uk - The Market Oracle is a FREE Daily Financial Markets Analysis & Forecasting online publication.


